Employment Gender Ratio Analysis Slide
RB0800077_6
- Last Update 03/28/2025
- File Size 1.3MB
- # of Slides 2
- File Format PPTX
- Slide Ratio 4:3
- Color
Keywords
- #Content-Based Slides
- #Design-Based Slides
- #Market and Competitor Analysis
- #Graph
- #Other
- #Market Status
- #Market Analysis
- #4:3
- #employment rate analysis PowerPoint
- #male female employment ratio slide
- #gender data visualization
- #employment statistics chart slide
- #comparative infographic PPT
- #how to present employment data in PowerPoint
About the Product
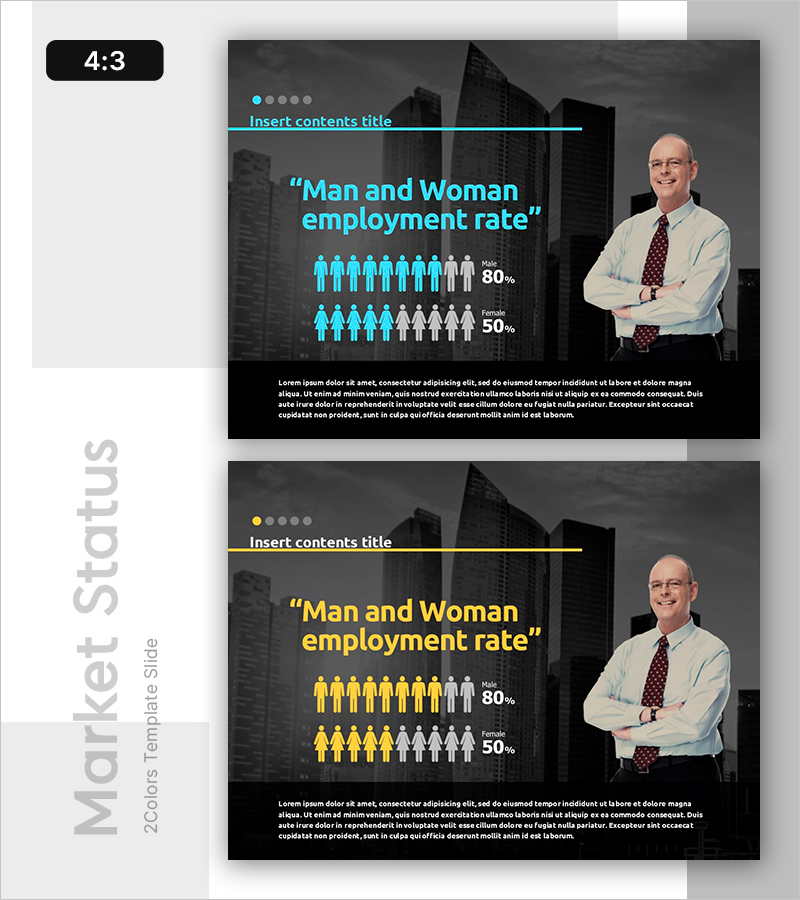
A PowerPoint slide that visually compares male and female employment rates using icon-based infographics. The slide displays employment data (e.g., Male 80%, Female 50%) with intuitive icon representations against a dark background, using cyan and yellow accents to maximize data readability. The 2-slide set provides color variations (cyan and yellow versions) of the same layout, allowing you to maintain consistency while diversifying emphasis points in your presentation. Ideal for market analysis reports, HR presentations, gender statistics briefings, and data-driven decision-making materials that require immediate deployment.
Usage Points
-
Main Usage
Presents male and female employment rate disparities through both numerical data and visual icons, enhancing audience comprehension. By visualizing gender statistics objectively, it serves as a credible evidence base for HR reporting, diversity initiatives, market research presentations, and policy discussions.
-
How to Use
Enter actual employment statistics into the text input areas and adjust the number of icons to match your data. Choose between the cyan or yellow layout version based on your presentation theme and background color. This approach maintains visual consistency while maximizing emphasis impact across your slides.
-
Recommended For
HR and personnel managers presenting employment status reports, executive-level gender diversity briefings, market research institutions analyzing employment statistics, policymakers explaining employment policies, and corporate ESG reports documenting gender representation metrics.
-
Slide Structure
Each slide contains a title area (Insert contents title), a quotation text section, and two comparative data rows. The upper row displays male employment rate (80%) and the lower row shows female employment rate (50%), both represented by 10 icons. A profile image space on the right enhances presenter credibility and audience engagement.
Related Products
-

Graph of Sales by Region – Visualizing Market Status
#Market and Competitor Analysis #Graph #Other
-

Industrial Data Report for Market Analysis Slides
#Market and Competitor Analysis #Diagram #Graph
-

Ratio Infographic Analysis Chart – Optimized for Market Analysis
#Market and Competitor Analysis #Diagram #Graph
-

Sales and Cost Area Graphs – Market Analysis Visualization
#Market and Competitor Analysis #Graph #Other
