Market Research and Trend Segmentation Chart – Effective Market Analysis
RJ0900002_22
- Last Update 08/16/2025
- File Size 2.1MB
- # of Slides 2
- File Format PPTX
- Slide Ratio 16:9
- Color
Keywords
- #Content-Based Slides
- #Design-Based Slides
- #Business Introduction
- #Market and Competitor Analysis
- #Graph
- #Industry Trends
- #Horizontal Bar
- #Segmented Horizontal Bar
- #16:9
- #horizontal segmented bar chart PowerPoint
- #market trend graph slide
- #stacked bar chart template
- #data comparison presentation
- #how to create segmented chart in PowerPoint
About the Product
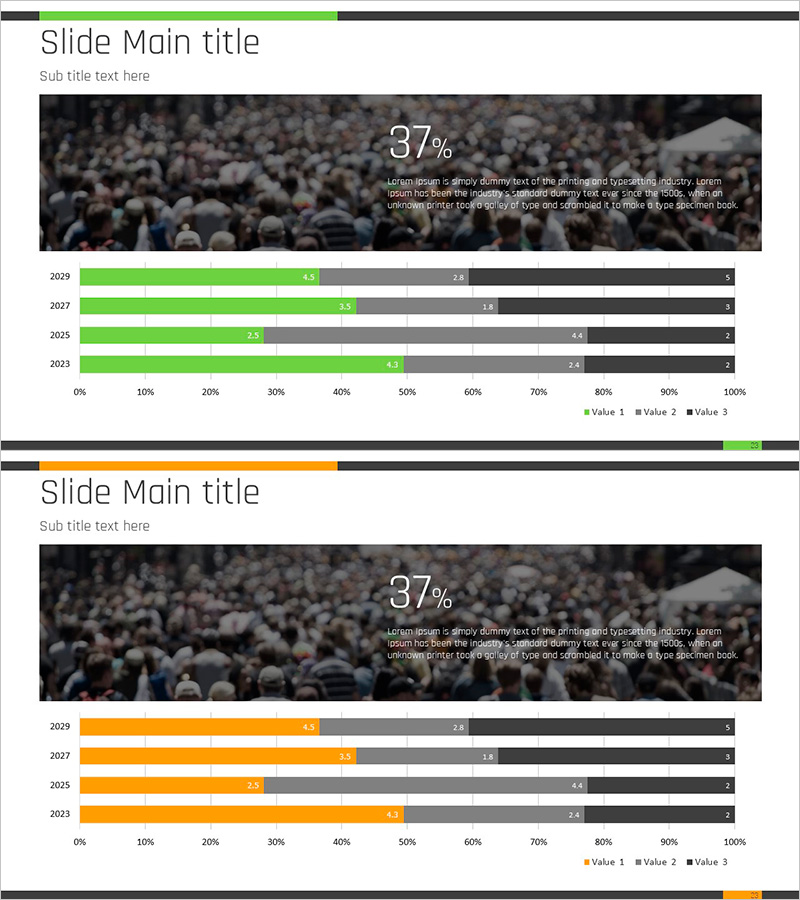
A horizontal segmented bar chart PowerPoint slide optimized for market research and trend analysis presentations. This slide deck features a lime green and gray color scheme that visualizes data across four years (2023–2029) segmented into three categories: Value 1, Value 2, and Value 3. Each bar is subdivided to display multiple metrics simultaneously, making it ideal for comparing market share, growth rates, competitive performance, and other complex datasets. The 2-slide presentation is formatted in 16:9 widescreen PPTX, fully editable and ready for immediate use in business reports and strategic presentations.
Usage Points
-
Main Usage
Clearly visualize year-over-year and category-by-category data comparisons in market research, business analysis, and sales reports. Displaying multiple metrics simultaneously strengthens decision-making evidence and improves audience comprehension.
-
How to Use
Input market share, revenue trends, customer satisfaction scores, or competitive performance data into the segmented bars. Edit the numerical values and legend labels to adapt the slide to various business contexts and reporting scenarios.
-
Recommended For
Marketing professionals, executives, sales teams, consultants, and research analysts presenting market trends, business performance, and competitive analysis. Particularly effective for quarterly and annual performance comparison reports.
-
Slide Structure
2-slide presentation featuring horizontal stacked bar charts with 4 years (2023–2029) and 3 data segments (Value 1, 2, 3) per year. Color-coded in lime green, gray, and black to distinguish data layers. Title area and 37% emphasis metric display space included at the top of each slide.
Related Products
-

Yearly Breakdown of Sales Trends – Visualizing Market Dynamics
#Business Introduction #Market and Competitor Analysis #Graph
-

Graphic Analysis of Safety Accidents – Market Insights and Trends
#Business Introduction #Market and Competitor Analysis #Graph
-

Blue Green Stacked Bar Chart – Market Trend Analysis
#Business Introduction #Market and Competitor Analysis #Graph
-

Construction Progress Chart – Business Introduction and Market Analysis
#Business Introduction #Market and Competitor Analysis #Graph
