Cumulative Results Over Four Years – Market Trends and Strategy
RB0800029-1_12
- Last Update 03/24/2025
- File Size 0.5MB
- # of Slides 2
- File Format PPTX
- Slide Ratio 4:3
- Color
Keywords
- #Content-Based Slides
- #Design-Based Slides
- #Business Introduction
- #Market and Competitor Analysis
- #Graph
- #Industry Trends
- #Horizontal Bar
- #Segmented Horizontal Bar
- #4:3
- #horizontal bar chart PowerPoint
- #cumulative data slide template
- #year-over-year comparison chart
- #market analysis graph
- #business performance chart
- #PowerPoint chart template download
About the Product
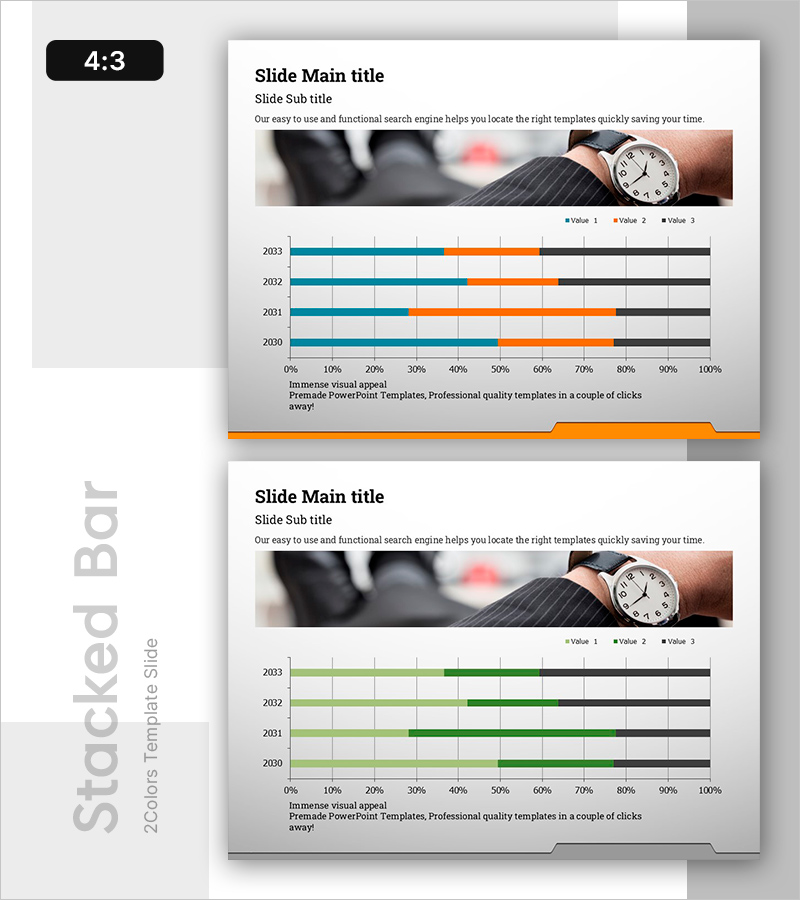
A horizontal bar chart PowerPoint slide visualizing four years of cumulative performance data. The slide features three data series in blue, orange, and black colors, enabling easy year-over-year comparison from 2030 to 2033. This presentation template is ideal for market trend analysis, competitive benchmarking, and business performance reporting. The 0%-100% horizontal axis and clear legend make data interpretation intuitive, and the slide is ready to use in business reports, strategy presentations, and market analysis decks.
Usage Points
-
Main Usage
This slide is designed to compare and analyze cumulative performance and market trends using numerical data. The three horizontal bar series clearly show the relative magnitude and progression of Value 1, 2, and 3 across each year, making it ideal for the core data section of business performance reports and strategy presentations.
-
How to Use
Simply replace the years (2030–2033) and percentage range (0%–100%) with your own data. Update the legend labels from Value 1, 2, 3 to your actual metrics (e.g., Revenue, Cost, Profit), then adjust the bar lengths to match your figures. The slide is immediately ready for presentation use.
-
Recommended For
Executives, marketing teams, sales departments, and strategic planning teams benefit from this template when presenting quarterly or annual performance reports, market share comparisons, and competitive benchmarking. It is particularly valuable for business plans, investor pitch decks, and marketing strategy presentations requiring multi-metric comparison.
-
Slide Structure
Two-slide set. The first slide features a blue-toned horizontal bar chart (4 years × 3 series), and the second provides the same structure in green tones for color variation options. Each slide includes title, subtitle, descriptive text areas, a 0%–100% horizontal axis, and a legend, formatted in 4:3 aspect ratio.
Related Products
-

Market Research and Trend Segmentation Chart – Effective Market Analysis
#Business Introduction #Market and Competitor Analysis #Graph
-

Yearly Breakdown of Sales Trends – Visualizing Market Dynamics
#Business Introduction #Market and Competitor Analysis #Graph
-

Blue Green Stacked Bar Chart – Market Trend Analysis
#Business Introduction #Market and Competitor Analysis #Graph
-

Construction Progress Chart – Business Introduction and Market Analysis
#Business Introduction #Market and Competitor Analysis #Graph
