Yearly Breakdown of Sales Trends – Visualizing Market Dynamics
RB0800027_11
- Last Update 03/23/2025
- File Size 2.4MB
- # of Slides 2
- File Format PPTX
- Slide Ratio 4:3
- Color
Keywords
- #Content-Based Slides
- #Design-Based Slides
- #Business Introduction
- #Market and Competitor Analysis
- #Graph
- #Industry Trends
- #Horizontal Bar
- #Segmented Horizontal Bar
- #4:3
- #horizontal bar chart PowerPoint
- #stacked bar graph slide
- #year-over-year sales analysis
- #market trend visualization PPT
- #sales comparison chart template
About the Product
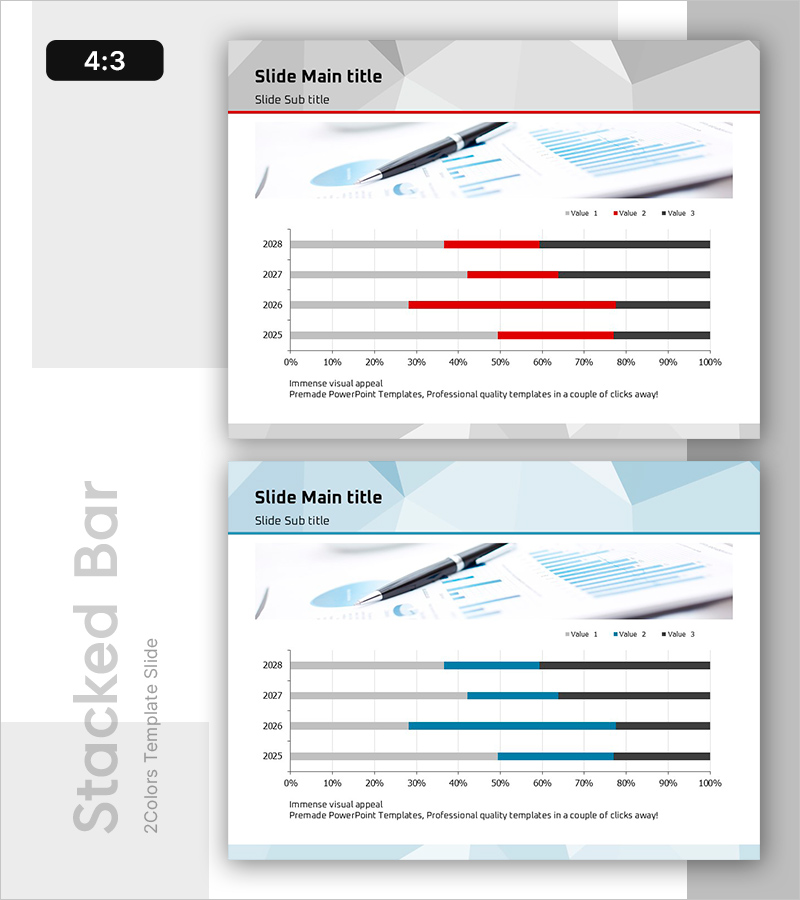
A horizontal stacked bar chart PowerPoint slide visualizing year-over-year sales trends from 2025 to 2028. The slide displays data across three value series (Value 1, Value 2, Value 3) using a 100% stacked bar structure in gray, red, and black color scheme. This design enables simultaneous comparison of annual proportions and cumulative trends, making it ideal for business presentations. Available in 4:3 ratio PPTX format with fully editable elements, perfect for sales reports, market analysis, business performance presentations, and investor communications.
Usage Points
-
Main Usage
Visualize multi-series time-series data such as annual sales performance, market share, or revenue distribution using a 100% stacked horizontal bar structure. This slide simultaneously displays compositional ratios and overall trends, making it highly effective for executive briefings, investor presentations, and sales team meetings where sales performance must be communicated persuasively.
-
How to Use
Open the slide and replace the bar chart data values with your actual sales figures. Edit the year labels, series names, and legend as needed. Customize colors to match your corporate brand palette if desired. You can also add pen annotations or animations during presentation for step-by-step emphasis.
-
Recommended For
Finance teams, executives, sales departments, marketing teams, and business development professionals can use this slide for quarterly and annual performance reports, business results presentations, investor relations materials, and market analysis documents. Particularly useful for management meetings and shareholder meetings where multi-division sales trends require comparison.
-
Slide Structure
Two-slide layout featuring title and subtitle areas with a 100% stacked horizontal bar chart representing 4 years (2025–2028) × 3 data series. Includes legend, axis labels, and gridlines for enhanced data readability. Top section features pen and chart imagery to establish a professional business document atmosphere.
Related Products
-

Market Research and Trend Segmentation Chart – Effective Market Analysis
#Business Introduction #Market and Competitor Analysis #Graph
-

Construction Progress Chart – Business Introduction and Market Analysis
#Business Introduction #Market and Competitor Analysis #Graph
-

Graphic Analysis of Safety Accidents – Market Insights and Trends
#Business Introduction #Market and Competitor Analysis #Graph
-

Blue Green Stacked Bar Chart – Market Trend Analysis
#Business Introduction #Market and Competitor Analysis #Graph
