Construction Progress Chart – Business Introduction and Market Analysis
RJ0900007_14
- Last Update 08/17/2025
- File Size 0.2MB
- # of Slides 2
- File Format PPTX
- Slide Ratio 16:9
- Color
Keywords
- #Content-Based Slides
- #Design-Based Slides
- #Business Introduction
- #Market and Competitor Analysis
- #Graph
- #Industry Trends
- #Horizontal Bar
- #Segmented Horizontal Bar
- #16:9
- #100% stacked bar chart PowerPoint
- #stacked bar graph template
- #construction progress chart slide
- #market analysis chart PPT
- #ratio comparison graph template
About the Product
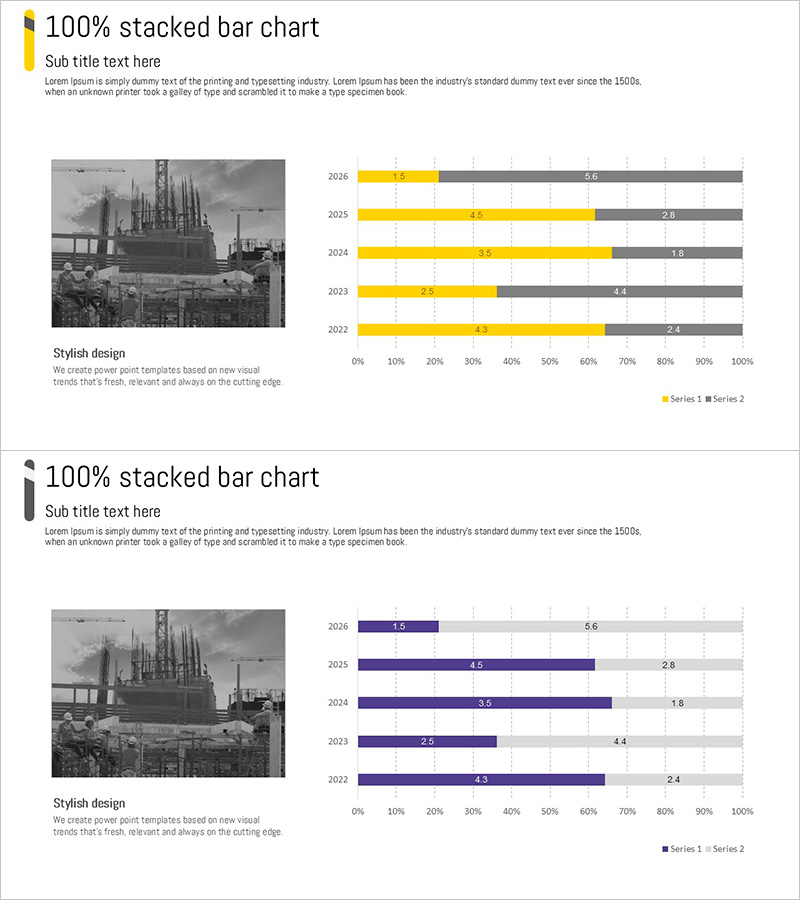
A 100% stacked bar chart PowerPoint slide designed to visualize construction project progress and market analysis trends. This presentation template displays data across five years (2022–2026) with two data series, using contrasting yellow and gray colors to clearly show the proportion changes of each category. The slide is immediately applicable to business reports, investor presentations, and market analysis decks. Optimized for 16:9 widescreen format with numerical labels included to enhance audience comprehension and data clarity.
Usage Points
-
Main Usage
Visualize year-over-year construction project progress, market share evolution, and business performance comparisons quantitatively. The 100% stacked format allows audiences to instantly grasp proportion changes relative to the whole, making it ideal for executive reports, investor pitches, and marketing strategy presentations.
-
How to Use
Replace the displayed numerical values with your own data for immediate use. Customize the yellow and gray color series to match your brand colors, and modify year labels or category names to adapt the chart to various comparative analyses and reporting scenarios.
-
Recommended For
Construction and real estate industry business reports, quarterly and annual performance presentations to executives, investor relations materials, marketing team market share analysis, consulting firm client proposals, and strategic planning decks.
-
Slide Structure
Two-slide set. The first slide features a yellow-accent color theme, while the second uses a dark blue accent theme—both presenting identical data structures in different color palettes. Each slide contains a 5-year (2022–2026) × 2-series stacked bar chart with numerical labels, legend, title, and subtitle areas.
Related Products
-

Graphic Analysis of Safety Accidents – Market Insights and Trends
#Business Introduction #Market and Competitor Analysis #Graph
-

Blue Green Stacked Bar Chart – Market Trend Analysis
#Business Introduction #Market and Competitor Analysis #Graph
-

Yearly Breakdown of Sales Trends – Visualizing Market Dynamics
#Business Introduction #Market and Competitor Analysis #Graph
-

Cumulative Results Over Four Years – Market Trends and Strategy
#Business Introduction #Market and Competitor Analysis #Graph
