Aurora Camping Customer Analysis Chart
RJ0600032_5
- Last Update 06/29/2025
- File Size 0.8MB
- # of Slides 2
- File Format PPTX
- Slide Ratio 16:9
- Color
Keywords
- #Content-Based Slides
- #Design-Based Slides
- #Market and Competitor Analysis
- #Graph
- #Market Share
- #Industry Trends
- #Column
- #Other
- #Segmented Column
- #Other Charts
- #16:9
- #stacked column chart PowerPoint
- #stacked bar graph slide
- #data visualization PowerPoint template
- #customer analysis chart
- #year-over-year comparison
- #infographic chart slide download
About the Product
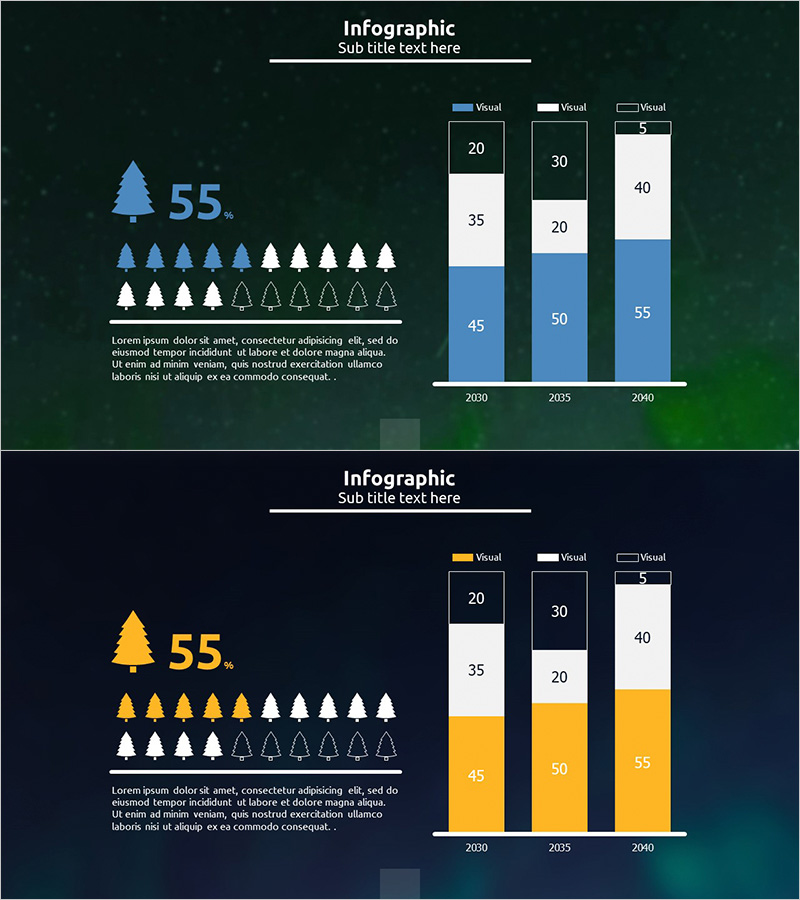
A PowerPoint slide featuring stacked column charts with aurora camping theme on dark green background. Two chart variations display customer analysis data across three years (2030, 2035, 2040) with three data series (45, 50, 55 values) represented in blue, yellow, and white segments. Left side includes tree icon infographic and 55% emphasis element. 16:9 aspect ratio PPTX format, fully editable for market research, customer analysis, and data-driven presentations.
Usage Points
-
Main Usage
Stacked column chart slide for comparing multi-series data across time periods or categories. Displays customer analysis, market research, sales performance, or departmental results by showing both total volume and compositional breakdown simultaneously.
-
How to Use
Use in business presentations, executive reports, marketing plans, and business analysis documents to explain data changes over time. Replace sample numbers with actual data to create ready-to-present slides for stakeholder meetings.
-
Recommended For
Marketing teams, sales departments, executives, data analysts, consultants, and project managers presenting customer segmentation, market share, growth trends, or budget allocation. Ideal for strategy meetings, quarterly reviews, investor presentations, and performance reports.
-
Slide Structure
2-slide deck. Each slide contains one stacked column chart for three years (2030, 2035, 2040). Each column divided into 3 data series (45, 50, 55 values) in blue, yellow, and white. Left infographic area with tree icon, 55% metric, and descriptive text. 16:9 aspect ratio PPTX format.
Related Products
-

Business Trends by Architectural Sector – Change and Growth
#Market and Competitor Analysis #Graph #Market Share
-

Pork Consumption Stack Chart – Market Trend Analysis
#Market and Competitor Analysis #Graph #Market Analysis
-

Segmented Vertical Bar Graph for Automotive Market Trends
#Market and Competitor Analysis #Graph #Other
-

Analysis of 3D Printing Progress – Market Trends and Insights
#Market and Competitor Analysis #Graph #Market Analysis
