Housing Construction Business Trend Graph – Market Analysis Opportunities
RJ0900015_10
- Last Update 08/20/2025
- File Size 0.9MB
- # of Slides 2
- File Format PPTX
- Slide Ratio 16:9
- Color
Keywords
About the Product
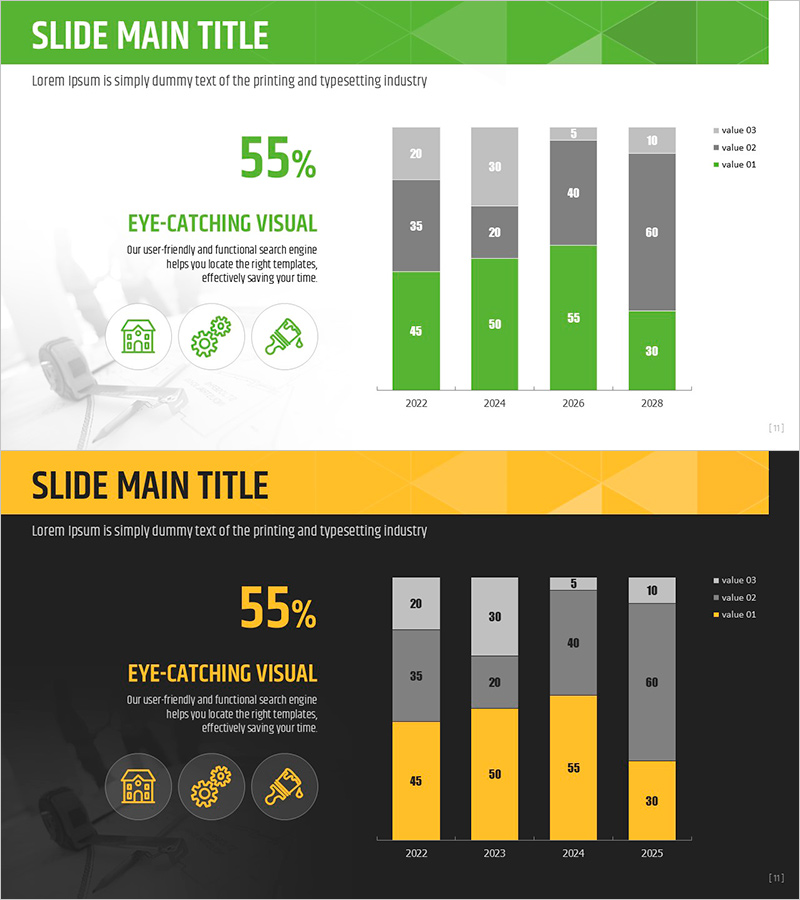
A stacked bar chart PowerPoint slide visualizing annual housing construction market trends and business cycle analysis. Designed with a two-color palette of green and gray, it displays data across four years (2022–2028) with three data series per year for clear year-over-year comparison. The left side features a 55% key metric and three supporting icons to highlight critical insights. This data visualization slide is ready to use in real estate, construction, and financial sector presentations for market analysis and business opportunity discussions.
Usage Points
-
Main Usage
Visualize and compare annual market size, growth rates, and business cycle indicators in real estate, construction, and finance sectors. The stacked bar format simultaneously conveys total volume and compositional breakdown for strategic decision-making.
-
How to Use
Use in market analysis presentations, business cycle reports, and investor briefings to explain year-over-year data trends. Lead with the left-side key metric and icons to establish main message, then reference the detailed chart data to support analysis.
-
Recommended For
Real estate developers, construction company executives, financial analysts, market research professionals, government policy makers. Ideal for business cycle analysis, performance reporting, investment feasibility reviews, and any presentation requiring quantitative market evidence.
-
Slide Structure
Title area at top + left side with 55% key metric and 3 supporting icons + right side with 4-year stacked bar chart (2022/2024/2026/2028). Each year displays 3 data series in green and gray tones. Includes legend. 16:9 aspect ratio across 2 slides.
Related Products
-

Visualizing Four-Year Change in Sales – An Effective Tool for Market Analysis
#Market and Competitor Analysis #Graph #Market Analysis
-

Four-Year Industrial Market Trends – Market Analysis and Decisions
#Market and Competitor Analysis #Financial Plans and Performance #Graph
-

Trends by Technology Graph – Market and Competitor Analysis
#Market and Competitor Analysis #Graph #Industry Trends
-

Segmented Vertical Bar Graph for Automotive Market Trends
#Market and Competitor Analysis #Graph #Other
