Competitor Revenue Analysis Graph
RJ0400057_10
- Last Update 06/02/2025
- File Size 0.9MB
- # of Slides 2
- File Format PPTX
- Slide Ratio 16:9
- Color
Keywords
- #Content-Based Slides
- #Design-Based Slides
- #Market and Competitor Analysis
- #Graph
- #Competitor Analysis
- #Competitive Advantage
- #Line
- #Line Chart
- #16:9
- #line chart PowerPoint slide
- #multi-series trend analysis
- #competitor analysis slide
- #revenue comparison chart
- #time-series data visualization PowerPoint
About the Product
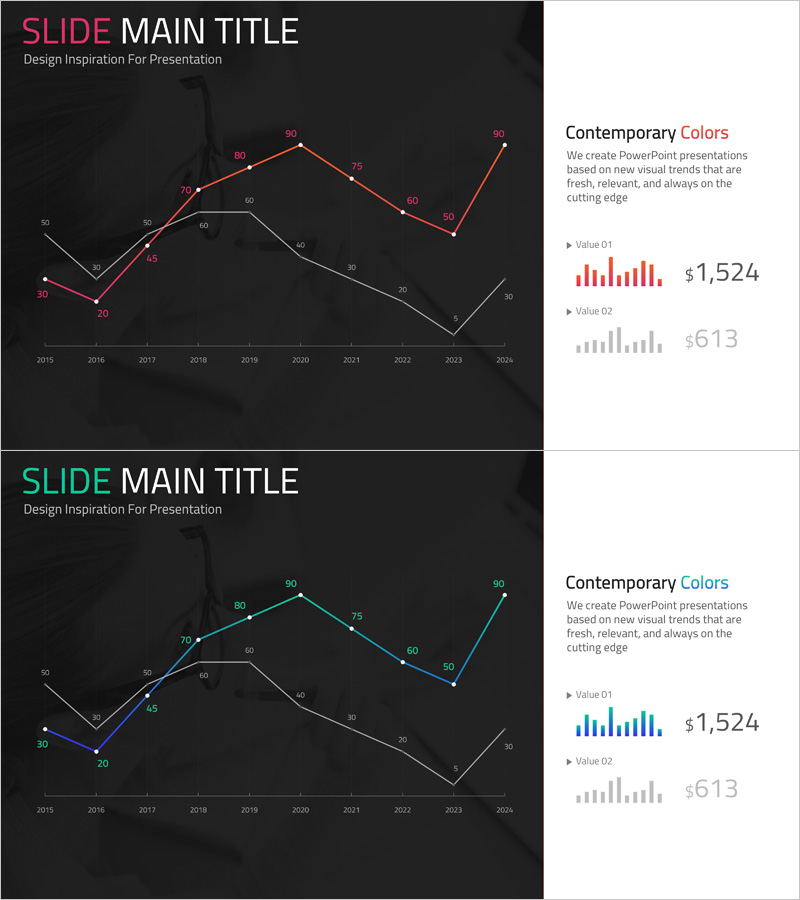
A multi-series line chart PowerPoint slide designed for competitor revenue analysis and trend comparison. The dark background features three colored lines (red, green, gray) tracking data points from 2015 to 2024, with numeric labels at each data point for precise value reference. The right panel displays 'Contemporary Colors' with descriptive text and two value metrics: Value 01 (red bar chart, $1,524) and Value 02 (gray bar chart, $613). This slide effectively visualizes time-series data for financial reports, market research, competitive analysis, and business performance presentations.
Usage Points
-
Main Usage
Compare time-series data across multiple categories (competitor revenue, market share trends, sales growth rates) using three or more colored lines. The high-contrast dark background ensures data visibility in projection environments and executive presentations.
-
How to Use
Input actual data into the left-side line chart and update the right-side Value metrics with key performance indicators (revenue, growth rate, market share). Customize line colors to match corporate branding, and edit year labels and numeric values for immediate use in presentations.
-
Recommended For
Finance team reports, investor pitch decks (IR materials), quarterly and annual performance reviews, competitive benchmarking analysis, market research findings, business performance evaluation presentations, and strategic planning sessions.
-
Slide Structure
2-slide set. Each slide features a left-side multi-series line chart (2015–2024, 10 data points, 3 colored lines: red, green, gray) with numeric labels, and a right-side panel with 'Contemporary Colors' title, descriptive text, Value 01 (red bar chart, $1,524), and Value 02 (gray bar chart, $613). 16:9 widescreen format, PPTX file.
Related Products
-

Business Competitor Analysis Graph – Visualizing Market Competitive Advantage
#Market and Competitor Analysis #Graph #Competitor Analysis
-

Competitor Idea Analysis Graph
#Market and Competitor Analysis #Graph #Competitor Analysis
-

Annual Investment Analysis Graph – Competitor Analysis and Cluster Visualization
#Market and Competitor Analysis #Diagram #Graph
-

Comparative Analysis Line Graph – Highlighting Competitive Advantage
#Market and Competitor Analysis #Graph #Competitor Analysis
