Curve Chart of Architectural Topics
RJ0300007_15
- Last Update 04/20/2025
- File Size 0.5MB
- # of Slides 2
- File Format PPTX
- Slide Ratio 16:9
- Color
Keywords
- #Content-Based Slides
- #Design-Based Slides
- #Market and Competitor Analysis
- #Graph
- #Competitor Analysis
- #Future Outlook
- #Line
- #Line Chart
- #16:9
- #line chart PowerPoint
- #trend analysis presentation slides
- #multi-series chart template
- #market analysis PPT
- #line graph slide design
- #data visualization PowerPoint
About the Product
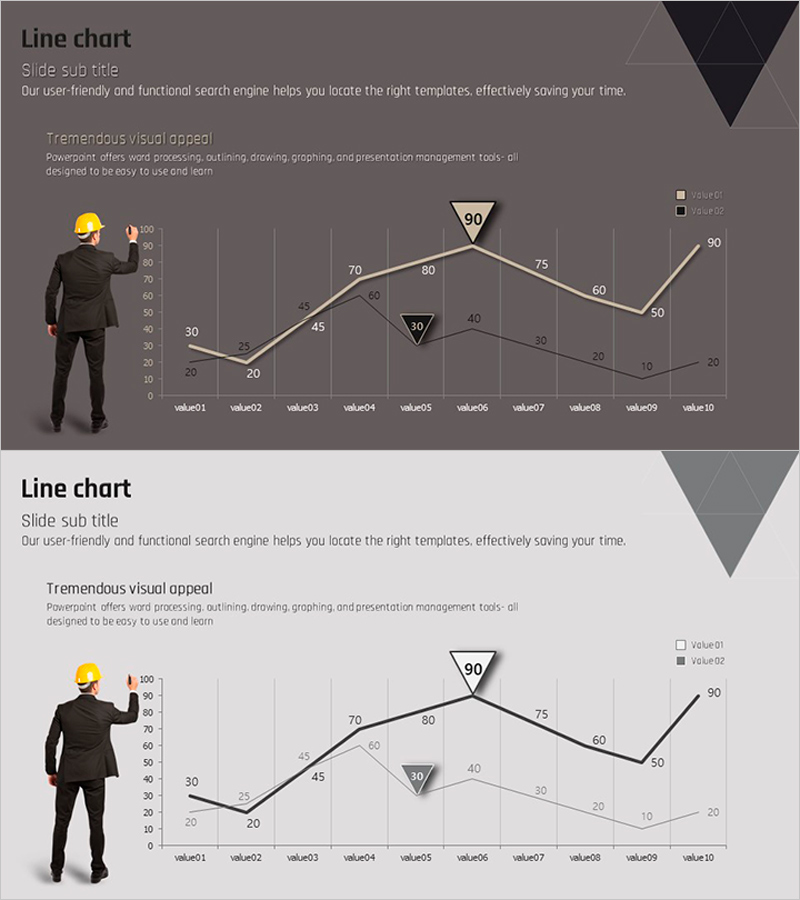
A 2-slide line chart PowerPoint template visualizing market trends in the architecture and construction industry. The slides feature a gray background with two data series (black and gray lines) representing 10 data points showing change over time. Each slide includes a construction worker illustration on the left to reinforce industry context, with numerical labels and triangular markers highlighting key inflection points. Ready-to-use presentation slides for competitive analysis, market analysis, and business forecasting.
Usage Points
-
Main Usage
Optimized for comparing and analyzing numerical changes and trends over time using dual-series line graphs. Effectively communicates various business metrics including competitive benchmarking, market growth rates, quarterly performance changes, and industry forecasts.
-
How to Use
Use in architecture, construction, and real estate industry presentations, market analysis reports, competitive analysis documents, and quarterly performance reviews. The gray-toned background and black lines convey professionalism, while numerical labels and emphasis markers guide audience attention to key turning points.
-
Recommended For
Ideal for executives, marketing managers, and sales teams in architecture, construction, and real estate companies presenting market trends and competitive positioning. Also suitable for consulting firms, financial institutions, and government agencies preparing industry analysis materials.
-
Slide Structure
2-slide set with identical layouts featuring color variations. Each slide comprises a left-side construction worker illustration, center line graph with 2 data series and 10 data points, and right-side legend. Key values are highlighted with triangular markers and numerical labels for emphasis.
Related Products
-

Curved Graphs and Analysis Messages – Market and Competitor Analysis
#Market and Competitor Analysis #Graph #Competitor Analysis
-

Competitor Analysis Broken Line Graph – Visualizing Market Trends
#Market and Competitor Analysis #Graph #Competitor Analysis
-

Watercolor Future Market Outlook Line Graph
#Market and Competitor Analysis #Graph #Future Outlook
-

War and Broken Line Graph – Market and Competitor Analysis Strategy
#Business Strategy #Market and Competitor Analysis #Graph
