Red Green Horizontal Bar Chart – Visualizing Market Trends
RJ0800047_9
- Last Update 08/13/2025
- File Size 0.2MB
- # of Slides 2
- File Format PPTX
- Slide Ratio 16:9
- Color
Keywords
About the Product
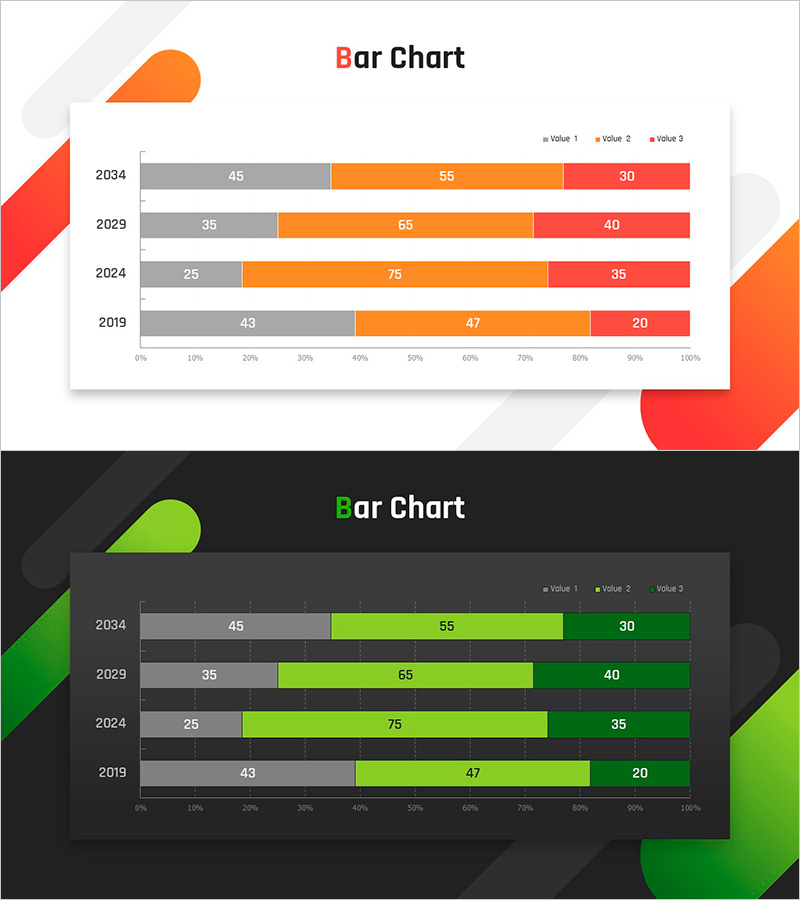
A horizontal bar chart PowerPoint slide comparing market trends across three data series by year. The chart visualizes data from 2019 to 2034 using red, orange, and green color-coded bars representing three distinct value series. Each year's bar displays a stacked composition ranging from 0 to 100%, with precise numerical labels for each segment. Two design versions are provided—one with a light background and one with a dark background—enabling flexible use across different presentation environments. This slide template is ready for immediate use in visualizing market share, sales distribution, customer satisfaction metrics, and other multi-dimensional comparisons in business presentations.
Usage Points
-
Main Usage
Compares three or more data series across multiple years—such as market trends, sales distribution, or customer satisfaction metrics. The stacked bar format clearly shows both absolute values and relative proportions, enabling simultaneous analysis of individual series and overall composition.
-
How to Use
Use in marketing plans, business reports, investor presentations, and quarterly reviews to illustrate market share evolution, product-line sales trends, or customer segment composition. The color-coded bars and numerical labels enable intuitive comparison and precise data communication without additional explanation.
-
Recommended For
Marketing and sales teams presenting market analysis, executive reports, financial analysis documents, and client proposals. Particularly effective in strategy meetings and performance reviews where multiple metrics must be compared simultaneously across time periods.
-
Slide Structure
2-slide set. Slide 1 features a light background (white/light gray) with red, orange, and green stacked bars; Slide 2 uses a dark background (dark gray/black) with identical chart structure. Each slide displays 4 year rows (2019, 2024, 2029, 2034) with 3 data series in horizontal stacked format, including 0–100% scale axis and precise numerical labels for each segment.
Related Products
-

Analyzing Flower Horizontal Segmentation Charts – Understanding Market Trends
#Market and Competitor Analysis #Graph #Industry Trends
-

Memorable Travel Destinations Survey Slide – Market and Competitive Analysis
#Market and Competitor Analysis #Graph #Industry Trends
-

Work and Home Life Graph – Market Trends and Design Sensibility
#Market and Competitor Analysis #Graph #Industry Trends
-

World Travel Template Horizontal Bar Segment Chart
#Market and Competitor Analysis #Graph #Industry Trends
