Yearly Milestones and Achievements – Market Trend Analysis
RB0800061_5
- Last Update 03/27/2025
- File Size 0.2MB
- # of Slides 2
- File Format PPTX
- Slide Ratio 4:3
- Color
Keywords
About the Product
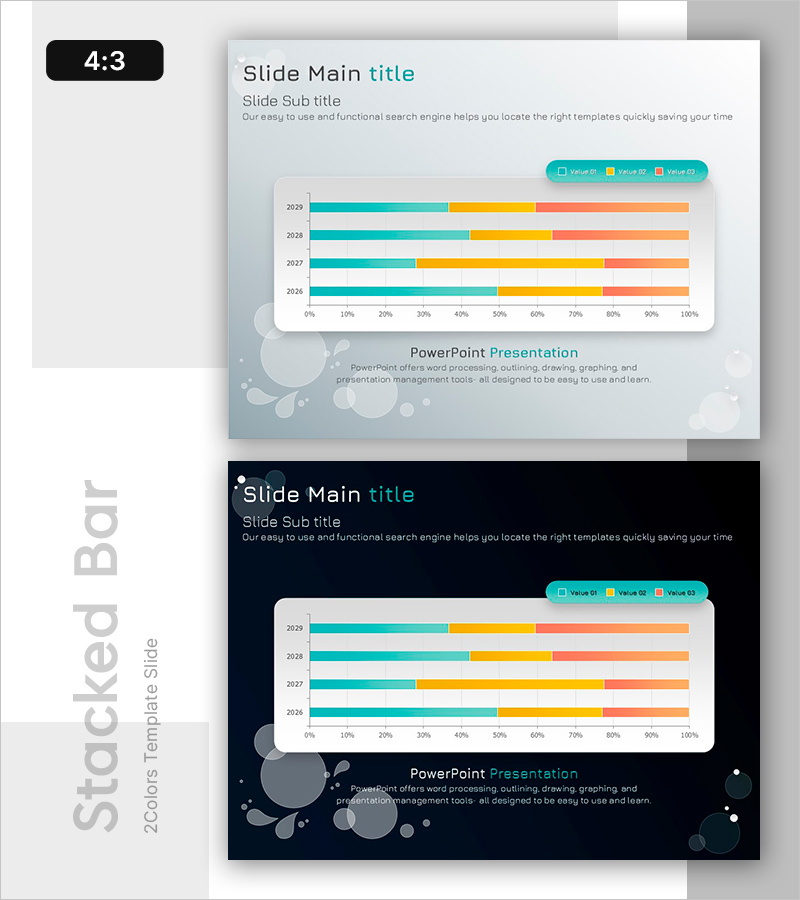
A horizontal bar chart PowerPoint slide designed to compare year-over-year performance across four years (2026–2029) using three data series represented in teal, yellow, and coral orange. This presentation template visualizes data distribution from 0% to 100% on the horizontal axis, making it ideal for business reports, market trend analysis, strategy execution reviews, and investor presentations. The slide deck is provided in 4:3 aspect ratio PPTX format with fully editable colors, values, and labels for seamless customization.
Usage Points
-
Main Usage
Effectively compare performance metrics, market share, revenue composition, or departmental results across multiple years or periods. The three distinct color-coded data series (teal, yellow, coral) enable clear visual differentiation, allowing audiences to quickly grasp comparative trends and performance variations.
-
How to Use
Ideal for business reports, quarterly reviews, investor presentations, strategy meetings, and market analysis briefings. Simply replace the sample data with your actual figures and adjust the legend labels to match your categories. The professional background design with circular graphic elements enhances credibility in executive-level presentations.
-
Recommended For
Business executives, marketing managers, financial analysts, strategy consultants, and project managers presenting performance metrics. Particularly effective for board meetings, investor relations presentations, annual reports, and stakeholder briefings where year-over-year comparisons are critical.
-
Slide Structure
Two-slide deck featuring identical bar chart layouts on contrasting backgrounds—light gray for the first slide and dark navy for the second. Each slide includes a title area, subtitle, descriptive text, a 4-year horizontal bar chart with 3 data series, a 0–100% horizontal axis, color-coded legend (Value 01, 02, 03), and decorative circular elements for visual consistency.
Related Products
-

Horizontal Bar Graph for Demand Analysis of Photographic Equipment - Market Trends
#Market and Competitor Analysis #Graph #Industry Trends
-

Road Bar Chart for Transportation Utilization
#Market and Competitor Analysis #Graph #Industry Trends
-

Geometry PPT Template Wide Horizontal Bar Segmentation Graph
#Market and Competitor Analysis #Graph #Industry Trends
-

Horizontal Bar Chart Against Eucalyptus Background – Market Trend Analysis
#Market and Competitor Analysis #Graph #Industry Trends
