Bar Chart for Eco-friendly Practices Trends Visualization
RJ0600099_21
- Last Update 07/18/2025
- File Size 1.2MB
- # of Slides 2
- File Format PPTX
- Slide Ratio 16:9
- Color
Keywords
- #Content-Based Slides
- #Design-Based Slides
- #Market and Competitor Analysis
- #Graph
- #Industry Trends
- #Horizontal Bar
- #Segmented Horizontal Bar
- #16:9
- #horizontal bar chart PowerPoint
- #bar graph presentation slide
- #data comparison chart
- #eco-friendly business trends visualization
- #numerical comparison template
About the Product
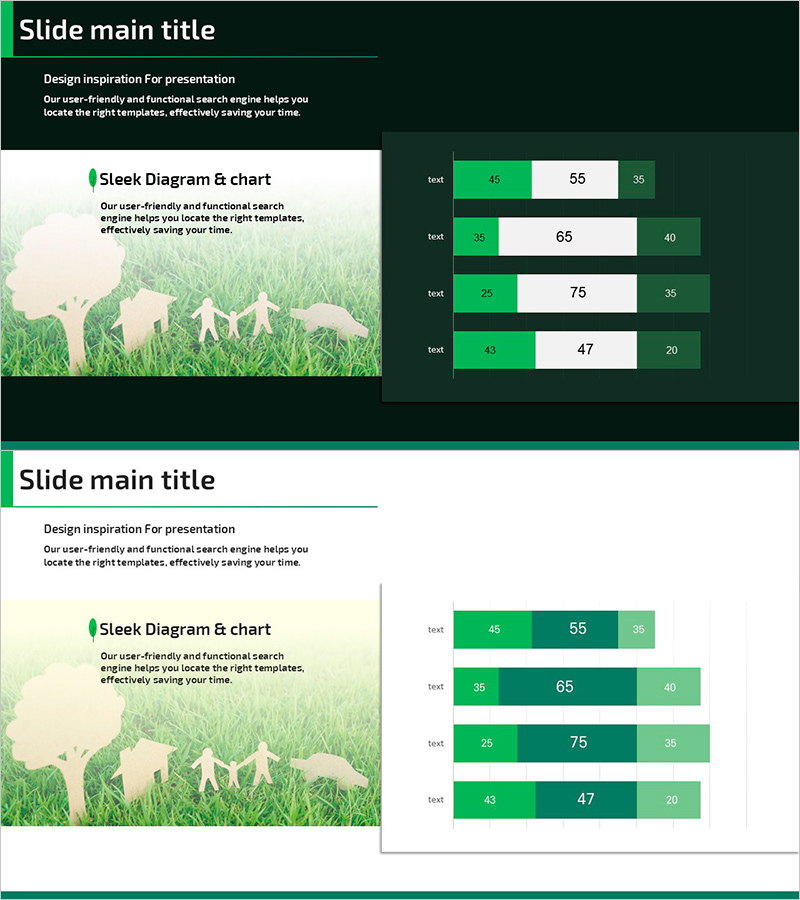
A horizontal bar chart PowerPoint slide that visualizes eco-friendly business trends and sustainability practices. Composed of three-tier data segments in dark green, light green, and white, this slide enables intuitive numerical comparison across four items. The 2-slide deck in 16:9 format is ready for immediate use in market analysis reports, business performance presentations, and environmental policy briefings. Text labels and numeric input fields are clearly separated for easy data editing, while the green color palette reinforces sustainability and credibility in your presentation.
Usage Points
-
Main Usage
Optimized for comparing eco-friendly business trends, sustainability metrics, and market analysis data across four categories. The bar length intuitively represents numerical magnitude, while the three-tier color scheme (dark green, light green, white) clearly differentiates data layers and segments.
-
How to Use
Enter item names in the text label areas and edit the numeric values in each bar segment. The 2-slide structure allows you to repeat the same graph layout for multiple datasets or present different data sequences progressively. The green-toned background image reinforces the eco-friendly theme throughout.
-
Recommended For
Ideal for environmental and sustainability business reports, eco-friendly policy presentations, market analysis materials, and corporate performance briefings. Recommended for marketing teams, strategy departments, and executive presentations requiring numerical comparisons and ranking visualizations.
-
Slide Structure
2-slide deck. Each slide contains four horizontal bar items, with each bar divided into three segments: dark green (left), white (center), and light green (right). Text labels and numeric input fields are distinctly positioned for straightforward data customization.
Related Products
-

Horizontal Bar Chart for Changes in the Climbing Population – Market Trend Analysis
#Market and Competitor Analysis #Graph #Industry Trends
-

Visualizing Camping Business Market Share with Bar Chart
#Market and Competitor Analysis #Graph #Industry Trends
-

Analyzing Flower Horizontal Segmentation Charts – Understanding Market Trends
#Market and Competitor Analysis #Graph #Industry Trends
-

Stacked Bar Graph for Growing Market Trends – Business Strategy
#Business Strategy #Market and Competitor Analysis #Graph
