Basic Red Green Table – Visualizing Financial Performance
RJ0800047_18
- Last Update 08/13/2025
- File Size 0.2MB
- # of Slides 2
- File Format PPTX
- Slide Ratio 16:9
- Color
Keywords
About the Product
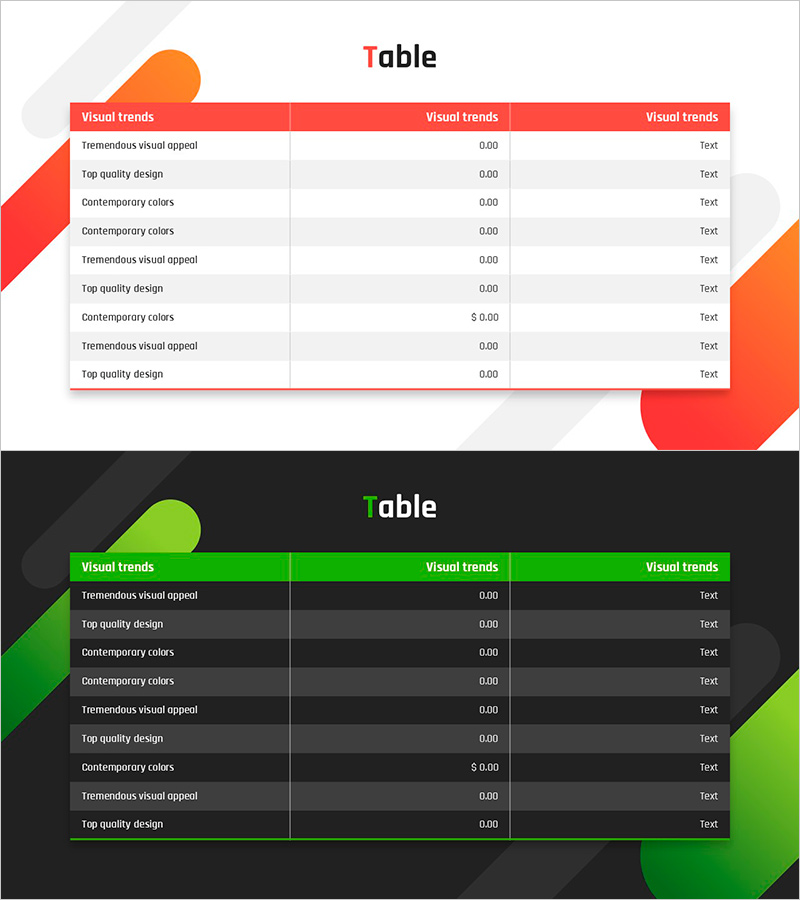
A professional 3-column data table PowerPoint slide designed to compare and analyze financial performance and key metrics with clarity. The red and green dual-tone header distinguishes positive/negative outcomes or target/actual results at a glance, while the central data column accommodates numerical entries to visualize cash flow statements, financial plans, and performance indicators. Provided in a 2-slide set featuring both light and dark background versions, allowing you to match your presentation environment and document style. Fully editable in PPTX format (16:9 aspect ratio), this template is ideal for corporate financial reports, investor presentations, and executive meetings.
Usage Points
-
Main Usage
Present financial data, performance metrics, and target-versus-actual results in a structured table format to communicate decision-critical information clearly. The red-green color distinction enables intuitive recognition of positive/negative trends or increases/decreases, enhancing the credibility of data-driven analysis materials.
-
How to Use
Input financial line items, numerical values, and percentages into the table cells to create cash flow statements, income statements, or financial ratio analyses. Select the light background version for printed documents and PDF distribution, or the dark background version for projector presentations and online meetings.
-
Recommended For
CFOs and finance managers presenting quarterly or annual financial performance; investors, banks, and regulatory bodies reviewing financial soundness; executive teams evaluating budget-versus-actual results in internal management meetings.
-
Slide Structure
Two 3-column table designs with red-green dual-tone headers for data distinction. Each cell is an editable text and numerical input area. The set includes both light background (white) and dark background (black) versions, allowing selection based on presentation context.
Related Products
-

Idea Presentation Wide Table Slide – Financial Performance Overview
#Financial Plans and Performance #Diagram #Cash Flow Statement
-

Key Financial Indicators Comparison – Cash Flow and Performance Analysis
#Financial Plans and Performance #Diagram #Cash Flow Statement
-

Table Chart with Light Background – Financial Planning Tool
#Financial Plans and Performance #Diagram #Cash Flow Statement
-

Modern Business Presentation Template Table - Visualizing Financial Plans and Performance
#Financial Plans and Performance #Diagram #Cash Flow Statement
