Modern Business Presentation Template Table - Visualizing Financial Plans and Performance
RJ0200028_14
- Last Update 04/05/2025
- File Size 6.8MB
- # of Slides 2
- File Format PPTX
- Slide Ratio 16:9
- Color
Keywords
- #Content-Based Slides
- #Design-Based Slides
- #Financial Plans and Performance
- #Diagram
- #Cash Flow Statement
- #Key Financial Indicators
- #Table
- #Standard Table
- #16:9
- #data table PowerPoint slide
- #horizontal table template
- #financial comparison slide
- #business data visualization
- #editable table PPT download
About the Product
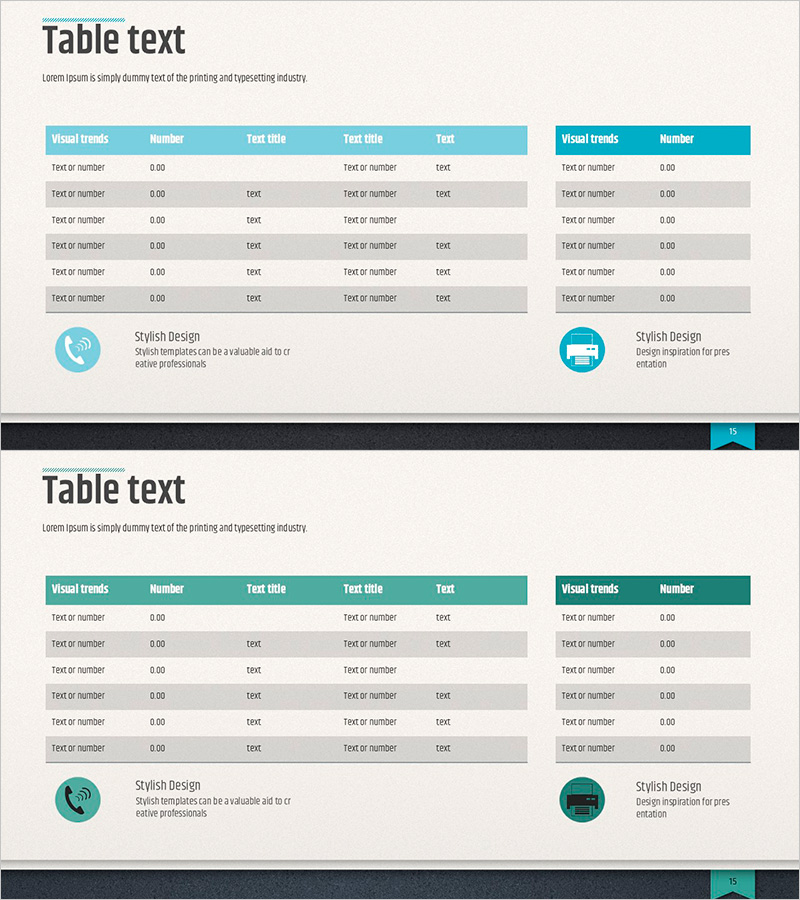
A horizontal data table PowerPoint slide designed to visualize financial plans and performance metrics. This presentation template features two side-by-side tables with teal headers and alternating gray rows, enabling clear comparison of numerical data across categories. Each table contains 5 columns and 6 rows, optimized for displaying financial figures, budget allocations, and performance indicators. Communication and presentation icons positioned below each table reinforce business credibility. Available in 16:9 PPTX format, fully editable and ready for immediate use in financial reports, quarterly performance presentations, and budget planning decks.
Usage Points
-
Main Usage
Organizes financial data, performance metrics, and budget items in a structured row-and-column format for easy comparison and analysis. The teal header establishes clear information hierarchy, while alternating gray rows enhance data readability. Side icons visually reinforce communication and presentation themes.
-
How to Use
Insert financial figures, quarterly results, or budget data into each cell. Customize row and column labels to match your specific metrics (revenue, expenses, profit, growth rate, etc.). Add or remove rows as needed, and adjust colors to match your corporate branding. The two-table layout supports year-over-year, department-by-department, or product-by-product comparisons.
-
Recommended For
CFOs, finance managers, and executives presenting quarterly earnings, investor reports, and budget reviews. Also suitable for marketing teams analyzing campaign performance, sales teams tracking targets vs. actuals, and operations teams displaying KPI dashboards.
-
Slide Structure
Two independent tables with teal headers (5 columns: Visual trends, Number, Text title, Text title, Text) and 6 alternating gray and beige rows. Communication icon positioned below left table; presentation icon below right table for visual balance and thematic reinforcement.
Related Products
-

Denim PPT Table Chart – Clearly Presenting Financial Performance
#Financial Plans and Performance #Diagram #Cash Flow Statement
-

Basic Red Green Table – Visualizing Financial Performance
#Financial Plans and Performance #Diagram #Cash Flow Statement
-

Teal Table Chart in Sky Template
#Financial Plans and Performance #Diagram #Cash Flow Statement
-

Table Chart with Light Background – Financial Planning Tool
#Financial Plans and Performance #Diagram #Cash Flow Statement
