Table Chart with Light Background – Financial Planning Tool
RB0800024_7
- Last Update 03/22/2025
- File Size 1.5MB
- # of Slides 2
- File Format PPTX
- Slide Ratio 4:3
- Color
Keywords
About the Product
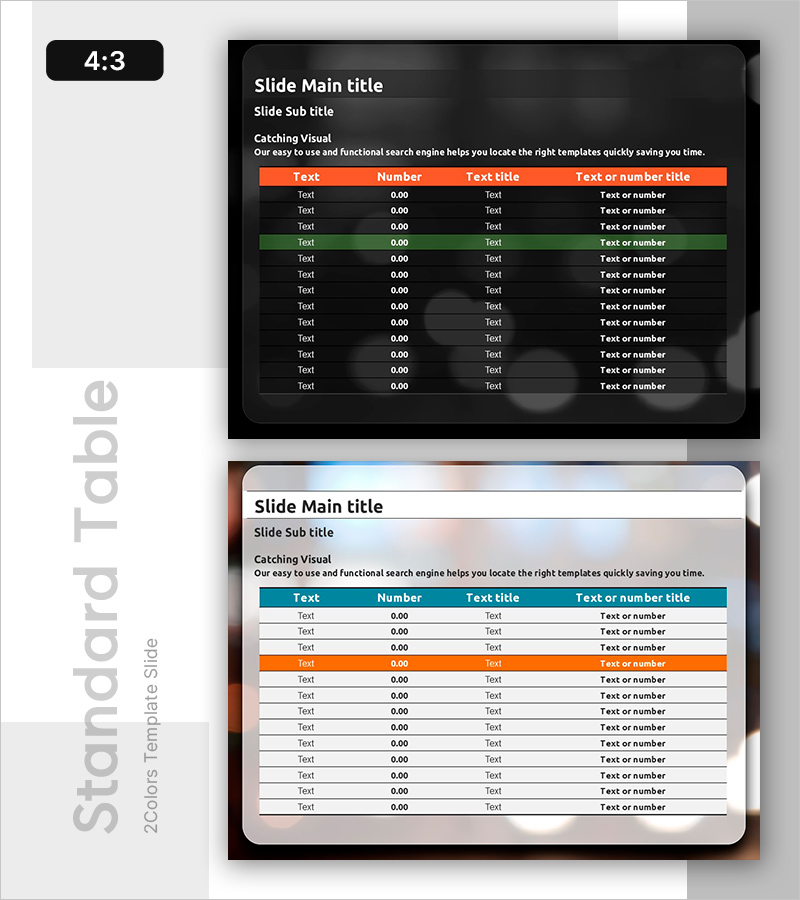
A data table PowerPoint slide available in both dark and light background versions. Featuring 4 columns (Text, Number, Text title, Text or number title) and 12 rows, this slide is optimized for financial planning, cash flow statements, and budget comparison analysis. Orange and green highlight rows visually distinguish key items, creating a balanced presentation of numerical data and text information for professional business slides.
Usage Points
-
Main Usage
Organize and present numerical data such as financial plans, cash flow statements, budget comparisons, and performance indicators. The 4-column 12-row structure clearly displays multiple items and figures for effective data visualization.
-
How to Use
Use the dark background version in dimly lit presentation venues and projector environments; use the light background version in bright conference rooms and printed materials. Emphasize key items through orange and green highlight rows, then directly input your text and numbers for immediate use.
-
Recommended For
Ideal for finance teams, planning departments, and sales teams presenting quarterly results, budget planning, and client proposals. Particularly suited for business presentations requiring numerical comparisons and item-by-item analysis.
-
Slide Structure
Composed of 4 columns (Text, Number, Text title, Text or number title) and 12 data rows. Header row features orange background; mid-section highlight row uses green background to express visual hierarchy. Provided in 4:3 aspect ratio, 2-slide set.
Related Products
-

Effective Note Template Table for Cash Flow Statements
#Financial Plans and Performance #Diagram #Cash Flow Statement
-

Denim PPT Table Chart – Clearly Presenting Financial Performance
#Financial Plans and Performance #Diagram #Cash Flow Statement
-

Perfect Presentation Template for Financial Performance Visualization with Table Design
#Financial Plans and Performance #Diagram #Cash Flow Statement
-

Idea Presentation Wide Table Slide – Financial Performance Overview
#Financial Plans and Performance #Diagram #Cash Flow Statement
