Idea Presentation Wide Table Slide – Financial Performance Overview
RJ0200030_12
- Last Update 04/06/2025
- File Size 0.7MB
- # of Slides 2
- File Format PPTX
- Slide Ratio 16:9
- Color
Keywords
About the Product
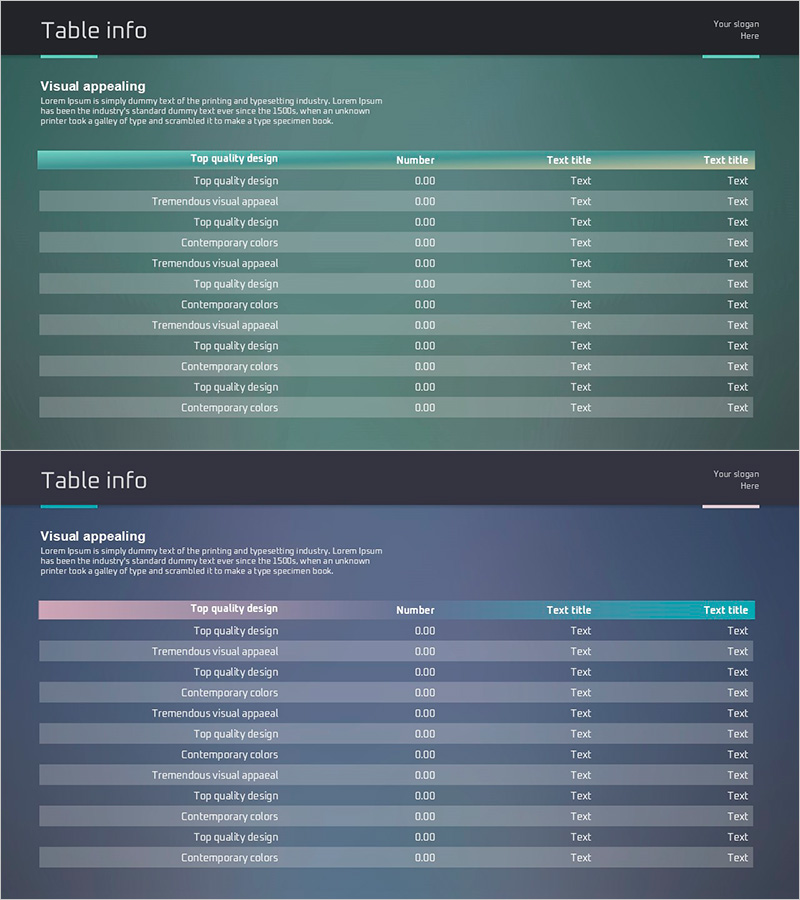
A 4-column data table PowerPoint slide designed to present financial performance and key metrics at a glance. Features a navy header row and gradient-shaded data rows that establish clear information hierarchy, making numerical data and text highly readable. This 2-slide set is optimized for 16:9 widescreen format and provides flexible table layouts for various reporting needs. Ready to use in financial reports, performance presentations, and business plan decks.
Usage Points
-
Main Usage
Visualize quantitative data such as financial results, sales performance, and operational metrics in a structured table format to communicate decision-critical information clearly. The distinct row and column separation makes complex datasets easy to understand and compare.
-
How to Use
Use in financial report performance summary sections, quarterly results presentations, business plan decks for goal-versus-achievement comparisons, and executive dashboard briefings. Freely edit headers and data rows to accommodate various metric combinations and reporting scenarios.
-
Recommended For
CFOs, finance managers, business planners, and executives preparing data-driven decision materials. Ideal for quarterly performance reviews, annual business plan presentations, and investor financial briefings.
-
Slide Structure
Two table layouts with 4 columns (item name, metric 1, metric 2, metric 3) and 11 data rows each. Navy header row with alternating dark gray and light gray row backgrounds enhance readability. All cells are optimized for text and numerical data entry.
Related Products
-

Teal Table Chart in Sky Template
#Financial Plans and Performance #Diagram #Cash Flow Statement
-

Denim PPT Table Chart – Clearly Presenting Financial Performance
#Financial Plans and Performance #Diagram #Cash Flow Statement
-

Square Frame Presentation Template for Financial Performance – Efficiency and Clarity
#Financial Plans and Performance #Diagram #Cash Flow Statement
-

Effective Note Template Table for Cash Flow Statements
#Financial Plans and Performance #Diagram #Cash Flow Statement
