Key Financial Indicators Comparison – Cash Flow and Performance Analysis
RB0800063_8
- Last Update 03/27/2025
- File Size 3MB
- # of Slides 2
- File Format PPTX
- Slide Ratio 4:3
- Color
Keywords
- #Content-Based Slides
- #Design-Based Slides
- #Financial Plans and Performance
- #Diagram
- #Cash Flow Statement
- #Key Financial Indicators
- #Table
- #Standard Table
- #4:3
- #financial indicators comparison table
- #cash flow statement PowerPoint
- #performance analysis slide
- #financial data table template
- #data table PPT slide
About the Product
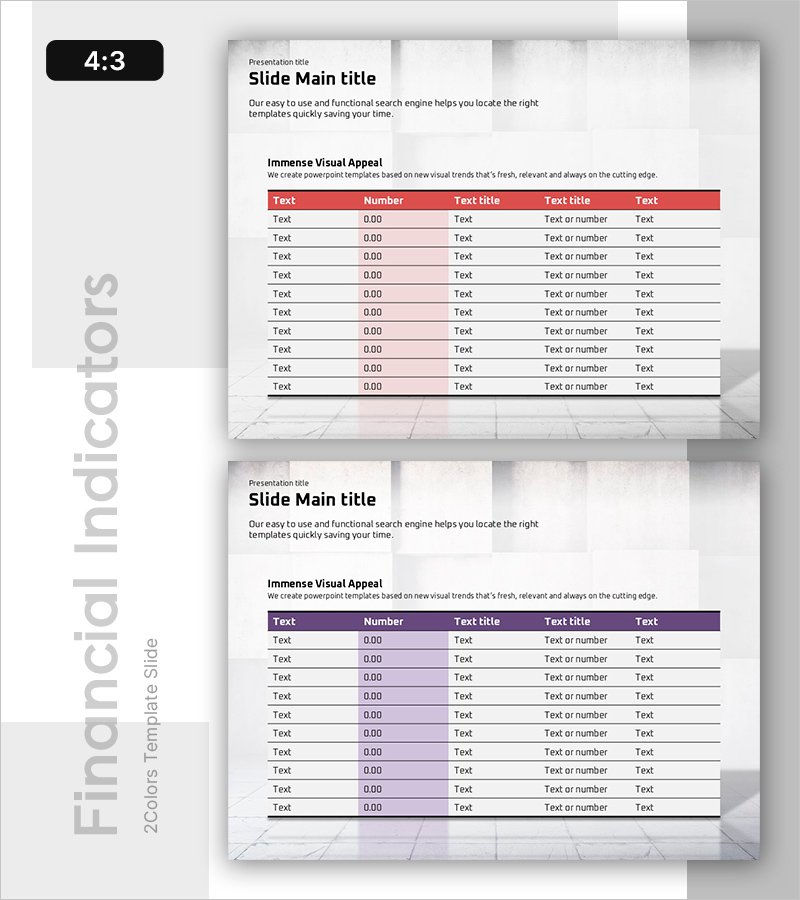
A data table PowerPoint slide designed for financial analysis and performance comparison. This presentation template features two color variations with red and purple header designs, structured as a 10-row by 5-column table for displaying cash flow statements, key financial metrics, and performance data. Each cell supports text, numeric, and percentage input, making it ideal for immediate use in financial reports and presentations. The 4:3 aspect ratio with 2-slide composition is perfect for financial planning, performance analysis, and investment review materials.
Usage Points
-
Main Usage
This table slide systematically organizes and compares financial analysis data. It clearly presents cash flow statements, key financial metrics, and performance results in a matrix structure for decision-making presentations. Supporting both numeric and text input, it serves as an essential tool for financial reports, investment reviews, and business plan presentations.
-
How to Use
Replace the header row labels (Text, Number, Text title, etc.) with your financial metric names and input corresponding values and descriptions in each cell. Choose between the red or purple header version based on your presentation theme and corporate branding. With 2 slides provided, you can duplicate and extend the structure for additional comparison items.
-
Recommended For
Ideal for presentations to CFOs, finance managers, executives, and investors. Use in business plans, financial reports, investment pitch decks, performance analysis documents, and quarterly review meetings. Particularly effective for cash flow analysis, income statement comparison, financial ratio analysis, and budget versus actual performance scenarios.
-
Slide Structure
Two-slide composition, each containing a 10-row by 5-column data table. The first slide features a red header row, while the second uses a purple header for color variation. The header row contains 5 item labels, with 10 data rows providing 50 editable cells total. Each cell supports text, numeric, and percentage input. The 4:3 aspect ratio is optimized for projector display and screen sharing.
Related Products
-

Idea Presentation Wide Table Slide – Financial Performance Overview
#Financial Plans and Performance #Diagram #Cash Flow Statement
-

Table Chart with Light Background – Financial Planning Tool
#Financial Plans and Performance #Diagram #Cash Flow Statement
-

Modern Business Presentation Template Table - Visualizing Financial Plans and Performance
#Financial Plans and Performance #Diagram #Cash Flow Statement
-

Denim PPT Table Chart – Clearly Presenting Financial Performance
#Financial Plans and Performance #Diagram #Cash Flow Statement
