Survey of Students' Device Utilization – Horizontal Bar Graph Slide
RJ0500043_8
- Last Update 06/19/2025
- File Size 1.3MB
- # of Slides 2
- File Format PPTX
- Slide Ratio 16:9
- Color
Keywords
- #Content-Based Slides
- #Design-Based Slides
- #Market and Competitor Analysis
- #Graph
- #Customer Analysis
- #Competitive Advantage
- #Column
- #Grouped Column
- #16:9
- #grouped bar chart PowerPoint
- #vertical bar graph slide
- #data comparison presentation
- #survey results visualization
- #how to create grouped chart in PowerPoint
About the Product
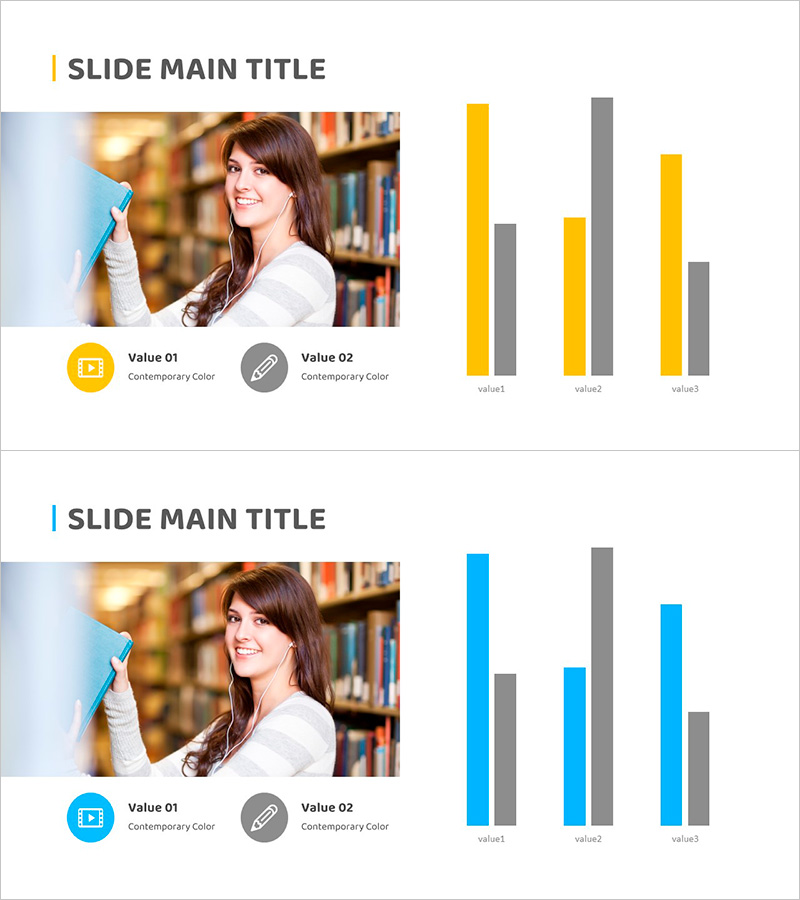
A grouped vertical bar chart PowerPoint slide for visualizing student device utilization survey data. This 2-slide set features a yellow and gray dual-tone color scheme with image and icon-based legend on the left, and comparative data for 3 items on the right. Each item displays 2 data series side-by-side, enabling clear contrast analysis ideal for market research, competitive positioning, and survey result presentations. Provided in 16:9 widescreen PPTX format with fully editable text and numerical values for immediate customization.
Usage Points
-
Main Usage
Visualizes two-series numerical data such as student device usage rates, market share, or product performance comparisons across 3 categories. Ideal for survey presentations, competitive analysis, and market overview slides where side-by-side item comparison is essential.
-
How to Use
Insert relevant photos or icons in the left image area, then replace the legend and values on the right chart with your actual data. Adjust the height of yellow and gray bars to accurately reflect your comparison metrics, and add title and descriptive text to match your presentation context.
-
Recommended For
Marketing plans, business reports, market analysis documents, academic presentations, and product comparison proposals. Particularly suited for education, IT, and consumer goods industries presenting user surveys, competitive advantages, and quarterly performance comparisons.
-
Slide Structure
2-slide layout. Each slide divides into left 50% image/icon area and right 50% chart area. Chart features X-axis with 3 items (value1, value2, value3), Y-axis numerical scale, and 2 data series (yellow and gray bars) per item for direct comparison.
Related Products
-

Layout Design Presentation Template for Market & Competitor Analysis – Column Chart
#Market and Competitor Analysis #Graph #Customer Analysis
-

Challenges to Improve Korea's Image Slide – Analysis by Age
#Market and Competitor Analysis #Diagram #Graph
-

Spring Pastel Wide PowerPoint Template Vertical Bar Chart
#Market and Competitor Analysis #Graph #Industry Trends
-

Bundled Charts by Category – Market and Competitor Analysis
#Market and Competitor Analysis #Graph #Market Analysis
