Trial PowerPoint Bundled Graph – Competitive Advantage Analysis
RJ0800035_6
- Last Update 08/10/2025
- File Size 0.2MB
- # of Slides 2
- File Format PPTX
- Slide Ratio 16:9
- Color
Keywords
About the Product
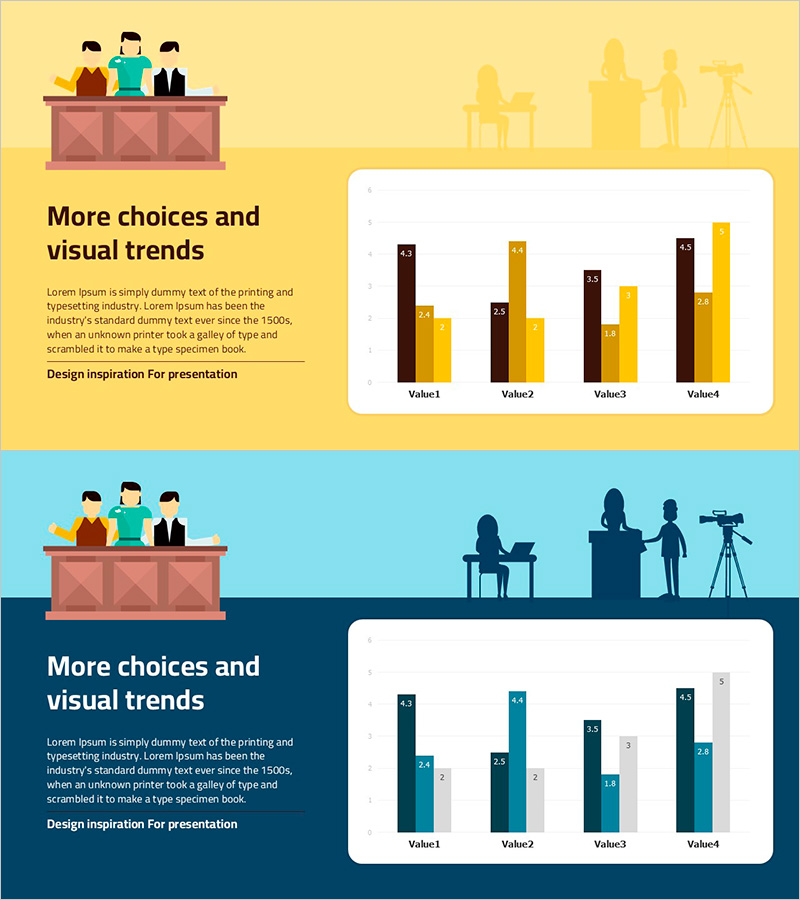
A 2-slide PowerPoint presentation featuring grouped bar charts for competitive advantage analysis. The slides display horizontal and vertical bar graphs with 4 data items (Value1–Value4) across 2 series in yellow and brown colors, enabling direct numerical comparison. Provided in 16:9 widescreen PPTX format, these slides are ready to use in market analysis, product performance benchmarking, and departmental results presentations. All colors, values, and labels are fully editable to match your presentation theme and data requirements.
Usage Points
-
Main Usage
Visually demonstrate competitive advantage by comparing your company's product performance, pricing, quality, or market metrics against competitors using grouped bar charts. The dual-series layout allows side-by-side comparison of multiple data points across categories.
-
How to Use
Use in investor presentations, sales pitches, and strategic planning meetings to showcase market share, customer satisfaction scores, product performance metrics, or departmental KPIs. Choose between horizontal or vertical bar layout depending on your presentation context and available space.
-
Recommended For
Marketing professionals, sales executives, strategy planners, and product managers preparing competitive analysis reports, market overview presentations, or performance reviews. Ideal for C-level presentations and client proposals requiring quantitative data-driven insights.
-
Slide Structure
Slide 1: Horizontal grouped bar chart with 4 items (Value1–Value4) and 2 series (brown and yellow). Slide 2: Vertical grouped bar chart with identical data structure. Both slides include title area, legend, axis labels, and data value annotations for clarity.
Related Products
-

Market Competition: Deep Dive into Top 3 Firms
#Market and Competitor Analysis #Graph #Competitor Analysis
-

3D Stacked Bar Breakdown - Market and Competitor Analysis
#Market and Competitor Analysis #Graph #Industry Trends
-

Four Color Infographic Bar Chart Template – Visualize Your Competitive Advantage
#Market and Competitor Analysis #Graph #Competitor Analysis
-

Construction Equipment Usage Graph
#Market and Competitor Analysis #Graph #Competitive Advantage
