Analysis of Changes in Avocado Purchases with Horizontal and Vertical Bar Graphs
RJ0800002_24
- Last Update 07/31/2025
- File Size 0.8MB
- # of Slides 2
- File Format PPTX
- Slide Ratio 16:9
- Color
Keywords
- #Content-Based Slides
- #Design-Based Slides
- #Market and Competitor Analysis
- #Graph
- #Market Status
- #Competitive Advantage
- #Column
- #Grouped Column
- #16:9
- #grouped bar chart PowerPoint
- #horizontal vertical bar graph slide
- #comparative analysis slide template
- #data visualization PPT
- #bar chart PowerPoint template download
About the Product
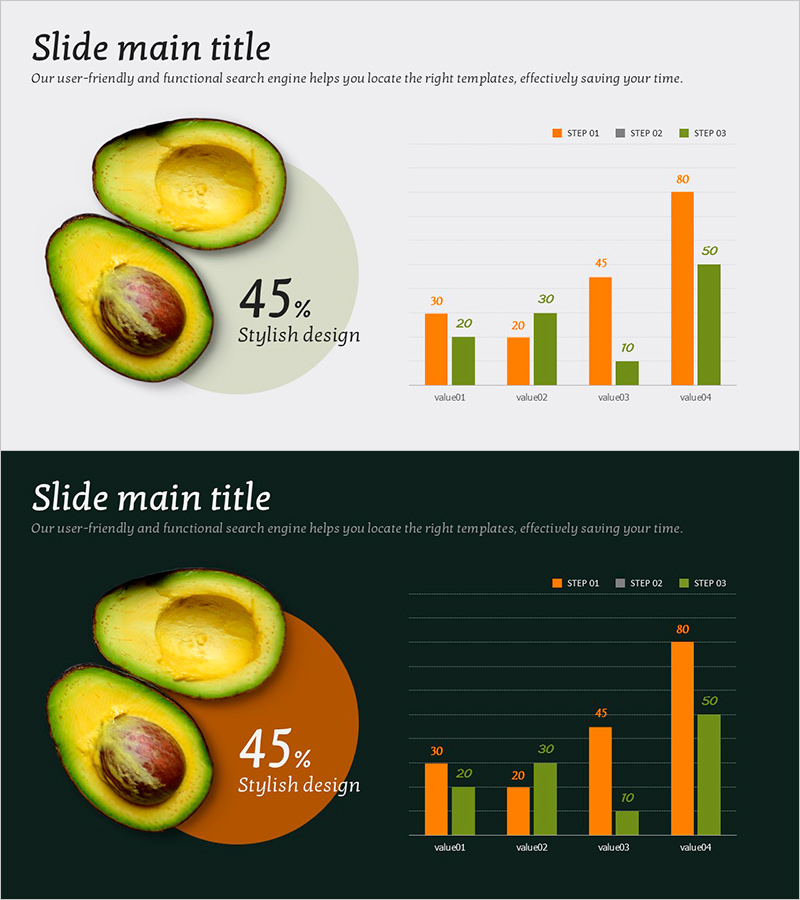
A 2-slide PowerPoint presentation combining horizontal and vertical bar charts for comparative data analysis. Features orange (STEP 01) and green (STEP 02) data series across 4 items, with product imagery and percentage values for intuitive market data visualization. Includes both light and dark background versions to match any presentation environment. Delivered in 16:9 widescreen PPTX format, fully editable and ready to customize with your own data.
Usage Points
-
Main Usage
Ideal for visualizing dual-metric comparisons such as market analysis, sales performance trends, product benchmarking, and year-over-year growth. The combination of horizontal and vertical bars enables clear differentiation between data series while maintaining visual balance and analytical clarity.
-
How to Use
Select slide 1 (light background) or slide 2 (dark background) based on your presentation theme. Replace the numerical values and category labels with your own data. Substitute the product image placeholder with your company's product photo or relevant visual asset.
-
Recommended For
Marketing reports, business performance presentations, market research findings, sales analysis, executive briefings, and competitive analysis. Recommended for marketing teams, sales departments, business analysts, data scientists, and C-level executives presenting comparative metrics.
-
Slide Structure
Slide 1 (light background): Product image with percentage on left; 4-item grouped bar chart (orange/green series) on right. Slide 2 (dark background): Identical layout with vertical bar chart format. Both slides include title, descriptive text, legend, and data labels.
Related Products
-

Muscle Mass Change Graph – Market Analysis Presentation
#Market and Competitor Analysis #Graph #Market Status
-

Bundled Charts for Infinite Energy Analysis
#Market and Competitor Analysis #Graph #Market Status
-

Horizontal Bar Graph Slide Template for European Tourism Demand Survey
#Market and Competitor Analysis #Graph #Market Status
-

The Importance of Modern People's Health Care – Insights from Market Analysis
#Market and Competitor Analysis #Graph #Other
