Office Interior Analysis Graph - Visualizing Competitive Advantage
RJ0900006_11
- Last Update 08/17/2025
- File Size 0.3MB
- # of Slides 2
- File Format PPTX
- Slide Ratio 16:9
- Color
Keywords
About the Product
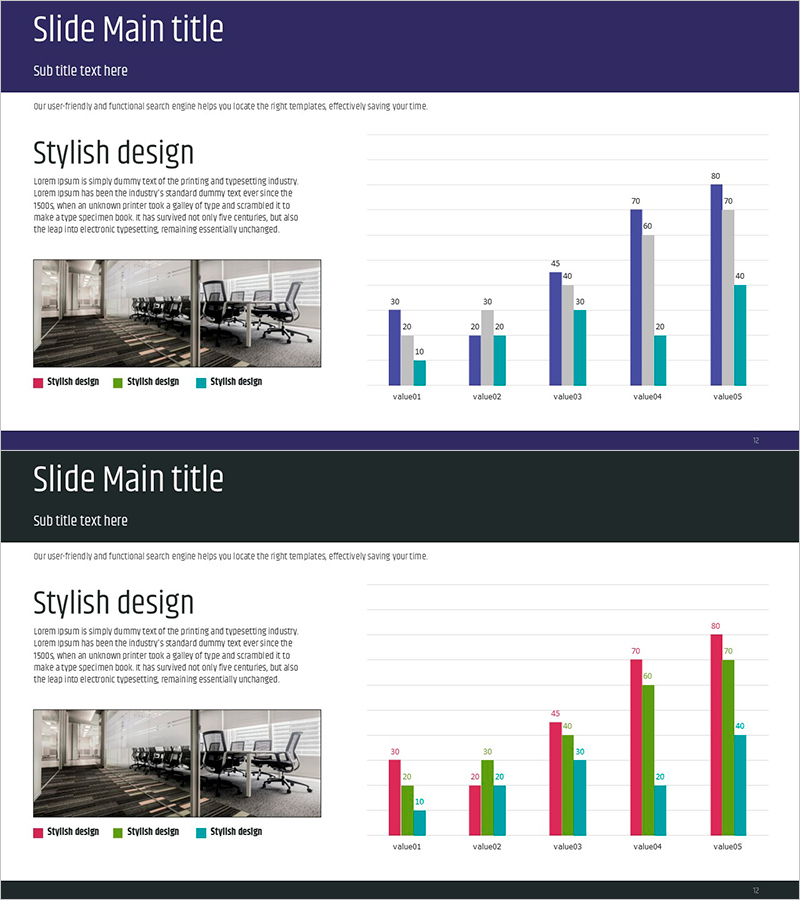
A grouped bar chart PowerPoint slide designed for office interior analysis and competitive comparison. This presentation template displays 5 data items (value01 through value05) across 3 series (red, green, blue) arranged side-by-side to enable simultaneous item-by-item comparison and inter-series differentiation. The dark navy header contrasts with the light background for optimal readability, while numeric labels above each bar ensure precise data communication. The 2-slide set is ready for immediate use in business presentations, market analysis reports, and strategic planning sessions.
Usage Points
-
Main Usage
Compares multiple data points across three or more categories simultaneously. Perfect for office interior evaluation, competitor benchmarking, market share analysis, sales performance comparison, and any presentation requiring multi-series numerical comparison.
-
How to Use
Bar height and color represent data values, with labeled numbers enabling precise comparison. Enter title and subtitle in the header area, use the legend to clarify each series meaning, and present with clear narrative context for maximum audience comprehension.
-
Recommended For
Marketing managers, sales directors, business executives, management consultants, data analysts, and strategy professionals presenting competitive analysis, market research findings, performance reports, and strategic initiatives.
-
Slide Structure
2-slide set. Each slide features a dark navy header (title and subtitle area), descriptive text section, and a grouped bar chart with 5 items × 3 series. Left side displays two office interior photos; right side shows the chart. Layout balances visual elements for professional presentation impact.
Related Products
-

Bundled Charts by Category – Market and Competitor Analysis
#Market and Competitor Analysis #Graph #Market Analysis
-

Bundled Bar Chart by Subject – Visualizing Competitive Advantages
#Market and Competitor Analysis #Graph #Market Analysis
-

Mobile Service Analysis Graph – Visualizing Market Competitiveness
#Market and Competitor Analysis #Diagram #Graph
-

Modern Business Plan Template – Clustered Column Graph
#Market and Competitor Analysis #Graph #Market Analysis
