Market Insights Through Competition Analysis Chart – Gaining Competitive Edge
RJ0600010_19
- Last Update 06/23/2025
- File Size 1.6MB
- # of Slides 2
- File Format PPTX
- Slide Ratio 16:9
- Color
Keywords
- #Content-Based Slides
- #Design-Based Slides
- #Market and Competitor Analysis
- #Graph
- #Competitor Analysis
- #Competitive Advantage
- #Column
- #Line
- #Grouped Column
- #Line Chart
- #16:9
- #line graph PowerPoint
- #bar chart slide template
- #competitive analysis presentation
- #data visualization PPT
- #trend analysis chart
- #comparison analysis slides
About the Product
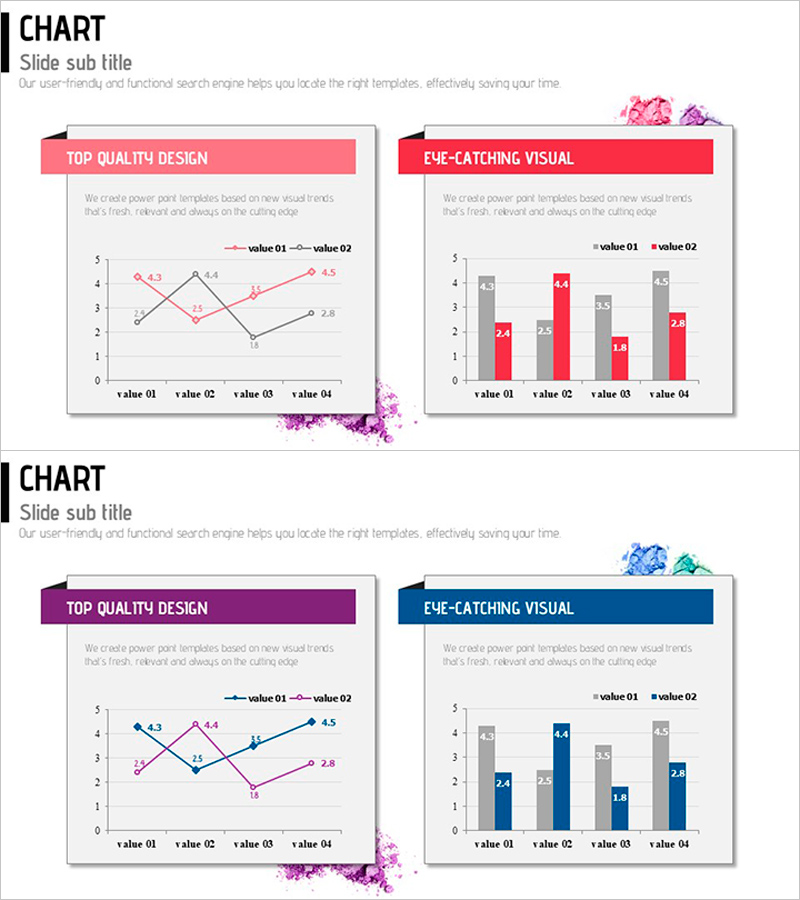
A PowerPoint slide combining line graph and bar chart to visually compare competitor performance and market trends. Available in three color themes—pink, purple, and navy blue—each slide displays four data items across two data series. The line graph emphasizes trend changes while the bar chart highlights item-by-item comparisons, effectively communicating market dynamics and competitive advantage. Provided in 16:9 widescreen PPTX format, fully editable and ready for marketing, strategy, and analysis presentations.
Usage Points
-
Main Usage
A data visualization slide that simultaneously displays competitor performance comparison and market trends. The line graph emphasizes temporal trend changes while the bar chart clearly shows item-by-item numerical comparisons, effectively communicating competitive advantage analysis and market insights.
-
How to Use
Use in marketing strategy presentations, business analysis reports, and executive briefing materials within the competitive comparison section. Double-click chart values and legends to replace with actual data for immediate presentation use. Select color themes to match your company brand identity.
-
Recommended For
Marketing professionals, strategy planning teams, executives, consultants, and analysts presenting quantitative data-driven market analysis. Ideal for product performance comparisons, business results evaluations, and competitive positioning presentations.
-
Slide Structure
Two-slide set. Each slide contains a title area, line graph (2 data series, 4 data points), and bar chart (2 data series, 4 items). The left-side line graph visualizes trends while the right-side bar chart displays item comparisons, with clear legends and numerical labels throughout.
Related Products
-

Analyzing 2 Comparison Graphs - Slides for Deriving Competitive Advantage
#Market and Competitor Analysis #Graph #Competitor Analysis
-

Competition Graphs and Analysis – Slides for Market Advantage
#Market and Competitor Analysis #Graph #Competitor Analysis
-

Simple Cement Theme Broken Line Graph – Market and Competitor Analysis
#Market and Competitor Analysis #Graph #Competitor Analysis
-

Financial Market Competitor Analysis Template – Emphasizing Competitive Advantage
#Market and Competitor Analysis #Graph #Competitor Analysis
