Donut Chart Visualization of Performance – Business Strategy
RJ0800035_5
- Last Update 08/10/2025
- File Size 0.4MB
- # of Slides 2
- File Format PPTX
- Slide Ratio 16:9
- Color
Keywords
About the Product
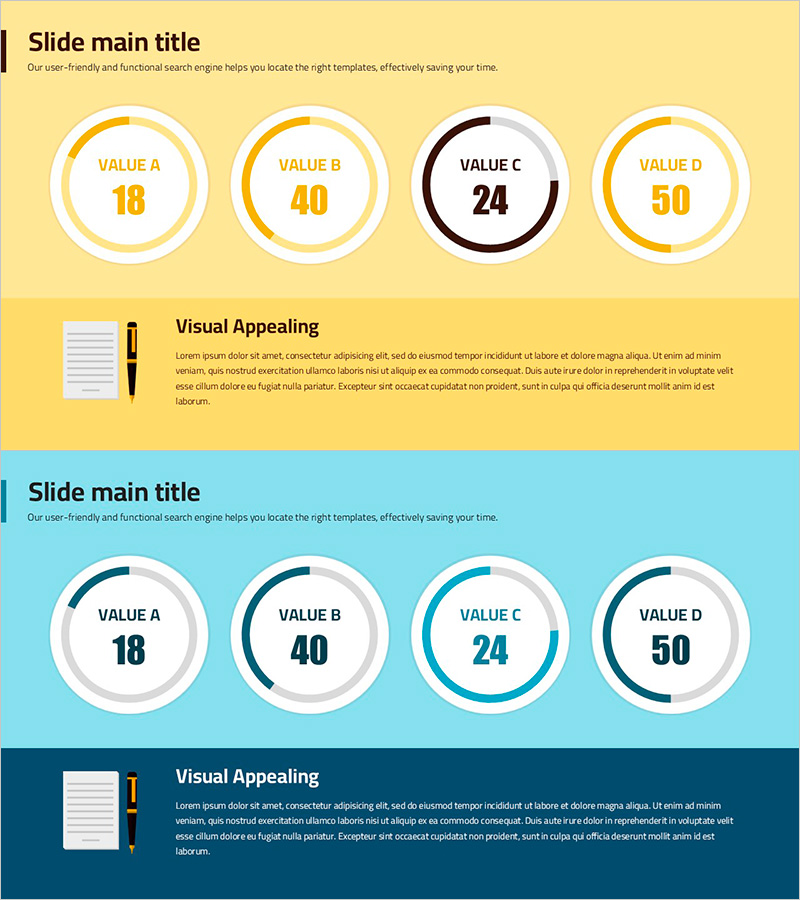
A professional donut chart PowerPoint slide designed to visualize business performance and strategic metrics. This presentation template features two color-coded design themes—yellow and blue—with each slide displaying a 4-segment donut chart for clear ratio representation. The hollow center of the donut allows you to place key titles or numerical values for enhanced visual impact. Ideal for business strategy presentations, market analysis reports, and performance reviews, this 2-slide set provides ready-to-use templates for immediate deployment in corporate presentations.
Usage Points
-
Main Usage
Visualize four key metrics—such as business performance, market share, budget allocation, or customer satisfaction—using a 4-segment donut chart. The hollow center provides space for highlighting core figures or titles, enabling quick data comprehension at a glance.
-
How to Use
Simply input your data values into the four color-coded segments of the donut chart on each slide. The yellow theme suits positive, upbeat presentations, while the blue theme conveys professionalism and credibility for formal reports. All text and numbers are fully editable.
-
Recommended For
Business strategy presentations, quarterly performance reports, market analysis briefings, investor pitch decks, and marketing planning meetings. Particularly valuable for finance teams, marketing departments, and executive-level reporting.
-
Slide Structure
Two-slide set with one 4-segment donut chart per slide. Layout includes title area at top, centered donut chart visualization, and descriptive text section at bottom. One slide features yellow background theme, the other blue background theme.
Related Products
-

Donut Chart Slide for Market & Competitive Analysis – Korea's Representative Image Survey
#Business Strategy #Market and Competitor Analysis #Graph
-

Construction Facilities Status Donut Chart – Visualizing Business Strategies
#Business Strategy #Market and Competitor Analysis #Graph
-

Donut Chart for Business Strategy Visualization – Performance-Focused Marketing
#Business Introduction #Business Strategy #Marketing Plan and Strategy
-

Visualizing Key Achievements with Blue Line Donut Chart – Business Strategy
#Company Introduction #Business Strategy #Graph
