Performance Analysis Graph by Field – Visualizing Business Performance
RJ0300002_9
- Last Update 04/19/2025
- File Size 15.4MB
- # of Slides 2
- File Format PPTX
- Slide Ratio 16:9
- Color
Keywords
- #Content-Based Slides
- #Design-Based Slides
- #Business Strategy
- #Market and Competitor Analysis
- #Graph
- #Text Box
- #Achievements
- #Market Analysis
- #Circles
- #Doughnut Chart
- #Sticky Note
- #16:9
- #circular progress chart PowerPoint
- #donut chart slide template
- #ratio visualization presentation
- #business performance graph PPT
- #data visualization slides download
About the Product
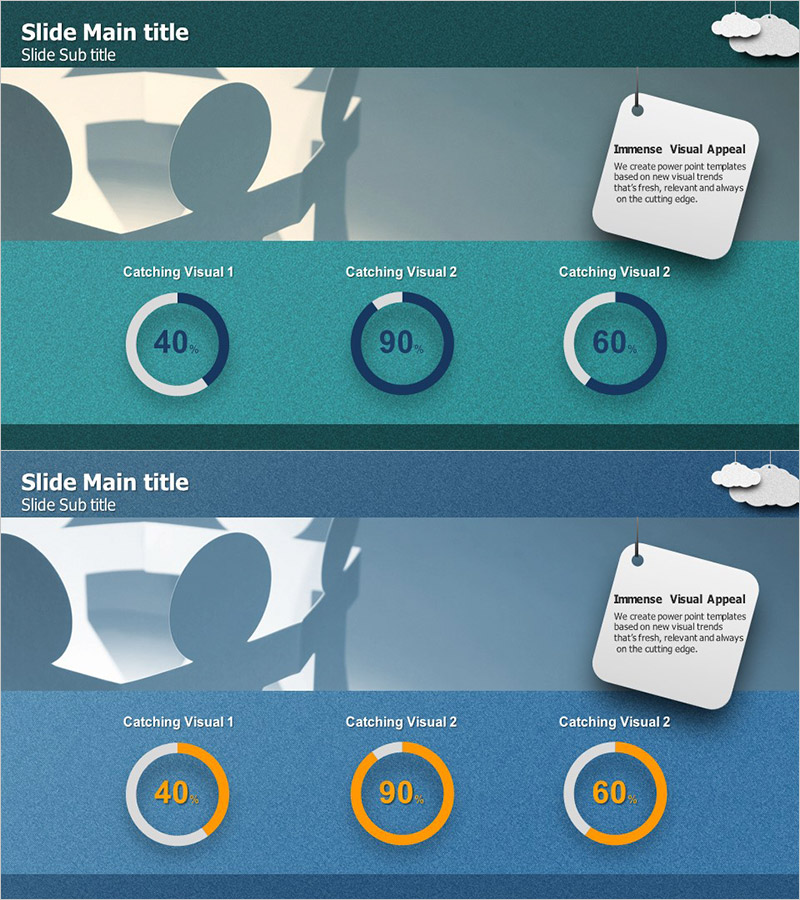
A professional circular progress chart PowerPoint slide set designed for business performance analysis. This 2-slide template features three donut-style progress indicators displaying percentage data in teal and orange accent colors. Each slide layout includes three circular charts arranged horizontally, perfect for comparing departmental performance, competitive benchmarking, or market share analysis. Sticky note memo elements enable you to highlight key insights and findings. Decorative cloud illustrations and abstract shapes add visual interest while maintaining a business-appropriate aesthetic. All elements are fully editable in PPTX format for immediate presentation use.
Usage Points
-
Main Usage
Visualize three-item percentage data using circular progress indicators to communicate business metrics, market share, or performance comparisons clearly to your audience. Integrated sticky note areas allow you to annotate key findings and strategic insights directly on the slide.
-
How to Use
Deploy these 2 slides in quarterly business reviews, strategy meetings, and performance reporting sessions. Edit the percentage values and chart labels to reflect your actual data, and customize the sticky note text with your analysis commentary. The teal-and-orange color scheme conveys both professionalism and strategic focus.
-
Recommended For
Marketing managers, business analysts, financial planners, and executives presenting performance reports will find this template ideal for quarterly reviews, market analysis, competitive positioning, and strategic planning meetings requiring multi-item comparison.
-
Slide Structure
Slide 1: Teal background with three circular progress charts (40%, 90%, 60% indicators) arranged horizontally, plus sticky note element on the right. Slide 2: Identical layout with orange accent color emphasis. Label areas below each chart for item naming and customization.
Related Products
-

Cosmetic Ingredient Ratio Chart – Doughnut Slide for Market Analysis
#Business Strategy #Market and Competitor Analysis #Graph
-

Water Resources Donut Chart Presentation Template
#Business Strategy #Market and Competitor Analysis #Graph
-

Donut Chart Comparison Slide | Data Visualization PPT
#Business Strategy #Market and Competitor Analysis #Graph
-

Doughnut Chart for Work Progress and Detailed Investigation
#Business Strategy #Market and Competitor Analysis #Graph
