Business Promotion Strategy Slide Template – Effective Market and Competitor Analysis
RJ0500002_7
- Last Update 08/30/2025
- File Size 1.4MB
- # of Slides 4
- File Format PPTX
- Slide Ratio 16:9
- Color
Keywords
About the Product
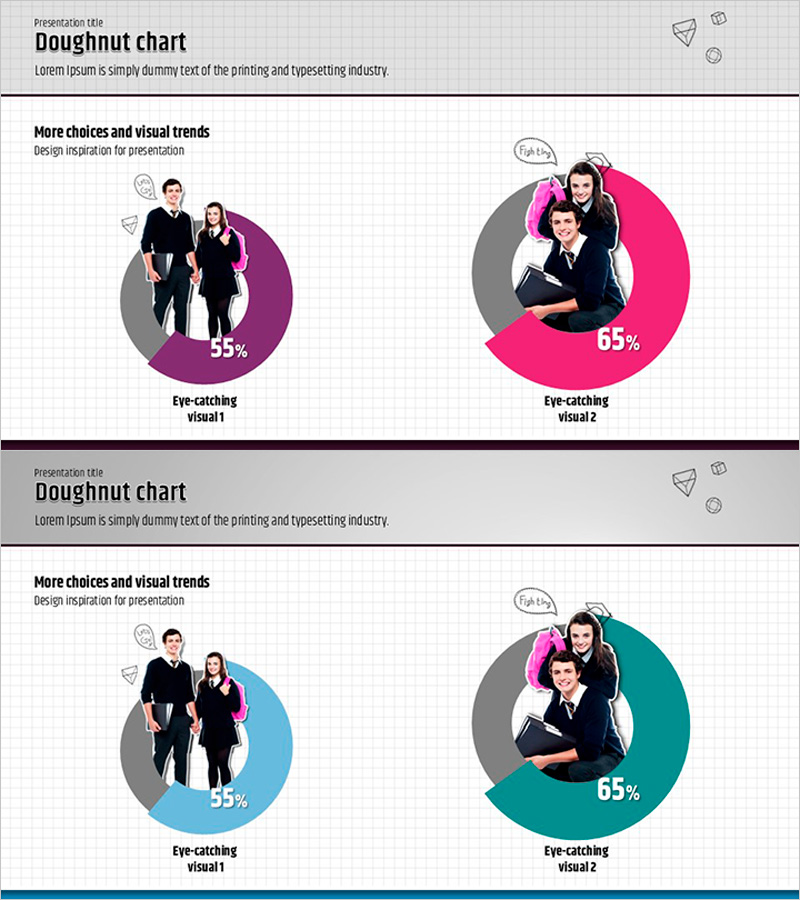
A professional doughnut chart PowerPoint slide set designed for business strategy presentations and market analysis reports. This 4-slide template features doughnut-shaped graphs in three color schemes: magenta, blue, and teal, with two charts per slide for comparative ratio visualization. The hollow center of each doughnut provides space to insert photos, logos, or key visual elements, creating strong visual impact while maintaining data clarity. Percentage values and labels are clearly displayed for quantitative communication. Delivered in 16:9 widescreen format and fully editable PPTX, ready for immediate customization and presentation.
Usage Points
-
Main Usage
Effectively compare two ratio-based datasets simultaneously, such as market share, customer demographics, revenue distribution, or organizational composition. The hollow center area allows insertion of supporting visuals—team photos, product images, or company logos—to reinforce key messages and engage audience attention.
-
How to Use
Double-click the doughnut chart values to input your actual data, then insert images or logos into the center circular area. Select from three color scheme variations to match your presentation tone. All labels, percentages, and text elements are fully editable to customize for your specific analysis.
-
Recommended For
Ideal for executive reports, business strategy presentations, marketing analysis decks, organizational performance reviews, and customer segmentation presentations. Recommended for executives, marketing teams, strategic planning departments, and sales teams presenting quantitative insights to stakeholders.
-
Slide Structure
4-slide set with 2 doughnut charts per slide arranged side-by-side. Each doughnut features a 2-segment structure for ratio representation, with a center circular area (approximately 40% diameter) for image insertion. Available in three color variations: magenta, blue, and teal.
Related Products
-

Performance Analysis Graph by Field – Visualizing Business Performance
#Business Strategy #Market and Competitor Analysis #Graph
-

Doughnut Chart for Work Progress and Detailed Investigation
#Business Strategy #Market and Competitor Analysis #Graph
-

Donut Chart Comparison Slide | Data Visualization PPT
#Business Strategy #Market and Competitor Analysis #Graph
-

Water Resources Donut Chart Presentation Template
#Business Strategy #Market and Competitor Analysis #Graph
