Soccer Game Illustration Graph for Market and Competitive Analysis
RJ0600037_7
- Last Update 06/30/2025
- File Size 0.6MB
- # of Slides 2
- File Format PPTX
- Slide Ratio 16:9
- Color
Keywords
- #Content-Based Slides
- #Design-Based Slides
- #Business Strategy
- #Market and Competitor Analysis
- #Graph
- #Other
- #Achievements
- #Customer Analysis
- #Circles
- #Doughnut Chart
- #Silhouette
- #16:9
- #doughnut chart PowerPoint
- #donut graph slide template
- #circular chart presentation
- #soccer silhouette PPT
- #ratio visualization slide
- #percentage chart download
About the Product
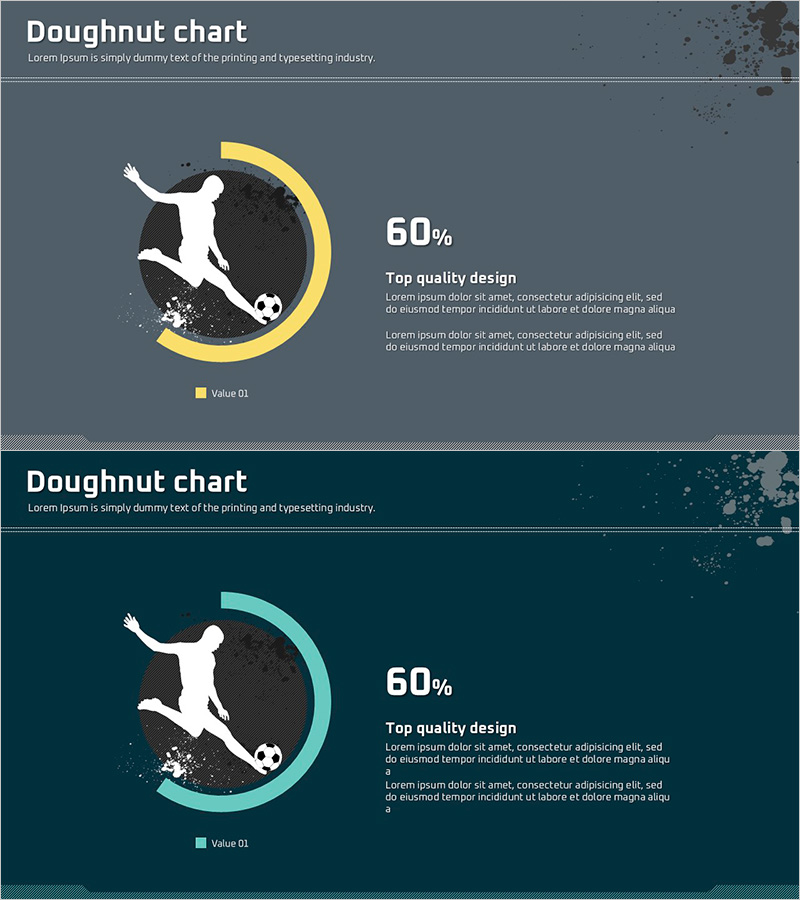
A 2-slide PowerPoint doughnut chart set featuring a soccer player silhouette illustration. Available in three color combinations: gray with gold accent, teal with gold accent, and additional variants. Each slide displays a centered doughnut chart with percentage values and right-aligned text description area, optimized for ratio-based data visualization. Perfect for market analysis, competitive comparison, performance metrics, and sports-related business presentations. Delivered in 16:9 widescreen PPTX format, fully editable in all PowerPoint versions with customizable data fields and color schemes.
Usage Points
-
Main Usage
This slide template visualizes part-to-whole ratios using a doughnut chart format. The soccer silhouette illustration adds thematic relevance for sports industry, entertainment, and leisure sector presentations. The centered percentage value and right-side text description clearly communicate data meaning and context for audience comprehension.
-
How to Use
Open the slide and replace the doughnut chart segments and percentage values with your actual data. Edit the right-side text box to include item names, descriptions, and data sources. Customize background colors, fonts, and chart size to match your corporate brand guidelines. Insert the modified slide into your presentation deck or export as a standalone visual asset.
-
Recommended For
Sports marketing reports, fan demographic analysis, soccer business proposals, entertainment industry performance presentations, sports equipment company earnings reports, sports event planning decks, and fan segmentation analysis. Ideal for marketing managers, sales professionals, business planners, and sports industry analysts preparing data-driven presentations.
-
Slide Structure
2-slide set. Each slide features a left-aligned soccer player silhouette with doughnut chart (center circle displaying 60% value) and right-aligned text area (title + two-paragraph description). Slide 1: gray and gold color scheme; Slide 2: teal and gold variant. 16:9 widescreen format with particle effect background. All elements are fully editable and scalable.
Related Products
-

Work Performance Analysis Graph – Visually Representing Employee Performance
#Market and Competitor Analysis #Graph #Other
-

Modern Business Presentation Template Doughnut Chart1 – Visualizing Performance and Strategy
#Business Strategy #Risk Management and Regulatory Compliance #Graph
-

Gender Ratio Customer Analysis Pie Chart – Emphasizing Customer Insights
#Market and Competitor Analysis #Graph #Other
-

Future Target Market Share Donut Chart – Performance and Competitiveness
#Business Strategy #Market and Competitor Analysis #Graph
