Coverage and Trends Graph – Market Trends and Competitive Analysis
RJ0800035_21
- Last Update 08/10/2025
- File Size 0.2MB
- # of Slides 2
- File Format PPTX
- Slide Ratio 16:9
- Color
Keywords
- #Content-Based Slides
- #Design-Based Slides
- #Market and Competitor Analysis
- #Graph
- #Industry Trends
- #Competitive Advantage
- #Column
- #Grouped Column
- #16:9
- #clustered bar chart PowerPoint
- #market trend graph slide
- #competitive analysis chart
- #4-item comparison template
- #how to create clustered bar chart in PowerPoint
About the Product
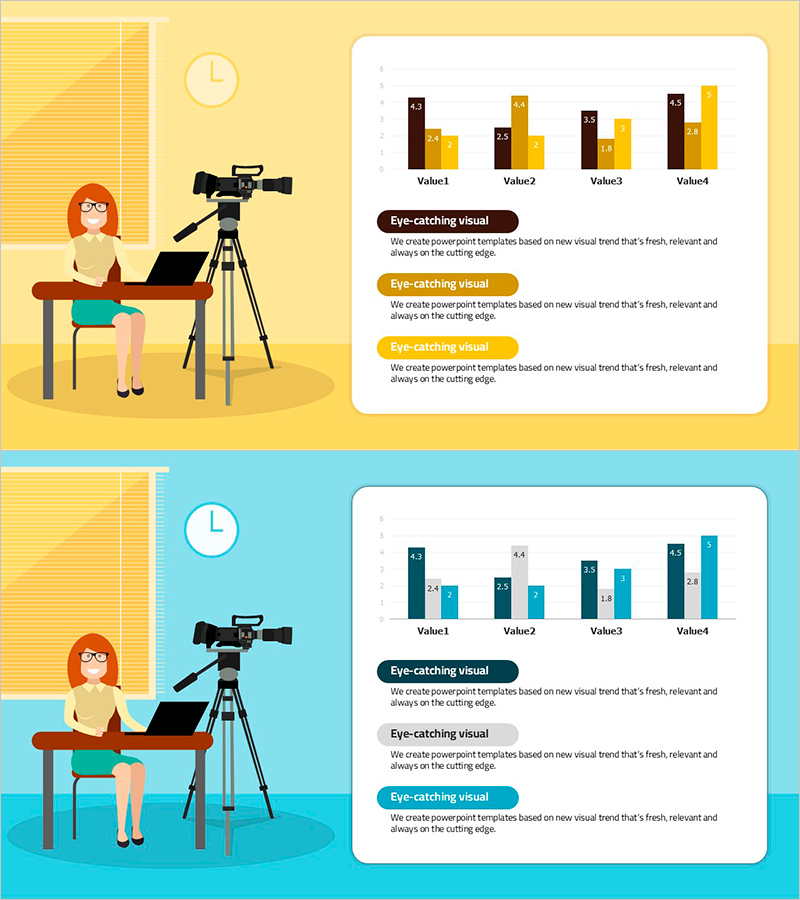
A clustered bar chart PowerPoint slide designed for market trend analysis and competitive comparison. This presentation template features both horizontal and vertical bar charts that enable intuitive comparison of multiple data series across four items. The brown and yellow dual-tone color scheme clearly distinguishes between two data series, making it ideal for visualizing comparative metrics. Perfect for business reports, strategic presentations, and competitive analysis decks that require clear numerical comparisons.
Usage Points
-
Main Usage
Visualize comparative data across multiple categories such as market trends, competitor benchmarking, sales performance, and quarterly results. The clustered bar format allows viewers to quickly compare two data series side-by-side, making numerical differences immediately apparent and enhancing audience comprehension.
-
How to Use
Replace the Value1 through Value4 labels and corresponding numbers with your actual data. Adjust the bar heights to reflect your metrics, and modify the category names as needed. You can easily add or remove items, and the color scheme can be customized to match your brand guidelines.
-
Recommended For
Marketing managers, sales directors, executives, management consultants, and business analysts presenting market analysis, competitive positioning, quarterly performance reviews, and strategic planning sessions. Ideal for any business presentation requiring quantitative multi-item comparisons.
-
Slide Structure
Two-slide set featuring horizontal clustered bar chart on slide 1 and vertical clustered bar chart on slide 2. Each chart displays 4 items with 2 data series. Three text annotation boxes (Eye-catching visual) are positioned below each chart for adding supporting analysis or key insights.
Related Products
-

Graph Slide Visualizing Changes in Divorce Numbers
#Market and Competitor Analysis #Graph #Text Box
-

Spring Pastel Wide PowerPoint Template Vertical Bar Chart
#Market and Competitor Analysis #Graph #Industry Trends
-

Five Color Powerpoint Template Wide – Charts and Mockups
#Market and Competitor Analysis #Graph #Other
-

3D Stacked Bar Breakdown - Market and Competitor Analysis
#Market and Competitor Analysis #Graph #Industry Trends
