Five Color Powerpoint Template Wide – Charts and Mockups
RJ0200009_31
- Last Update 03/30/2025
- File Size 4.6MB
- # of Slides 2
- File Format PPTX
- Slide Ratio 16:9
- Color
Keywords
- #Content-Based Slides
- #Design-Based Slides
- #Market and Competitor Analysis
- #Graph
- #Other
- #Industry Trends
- #Competitive Advantage
- #Column
- #Grouped Column
- #Mockup
- #16:9
- #smartphone mockup PowerPoint
- #horizontal bar chart slide
- #mobile app data visualization
- #device mockup presentation template
- #5-color bar graph PPT
About the Product
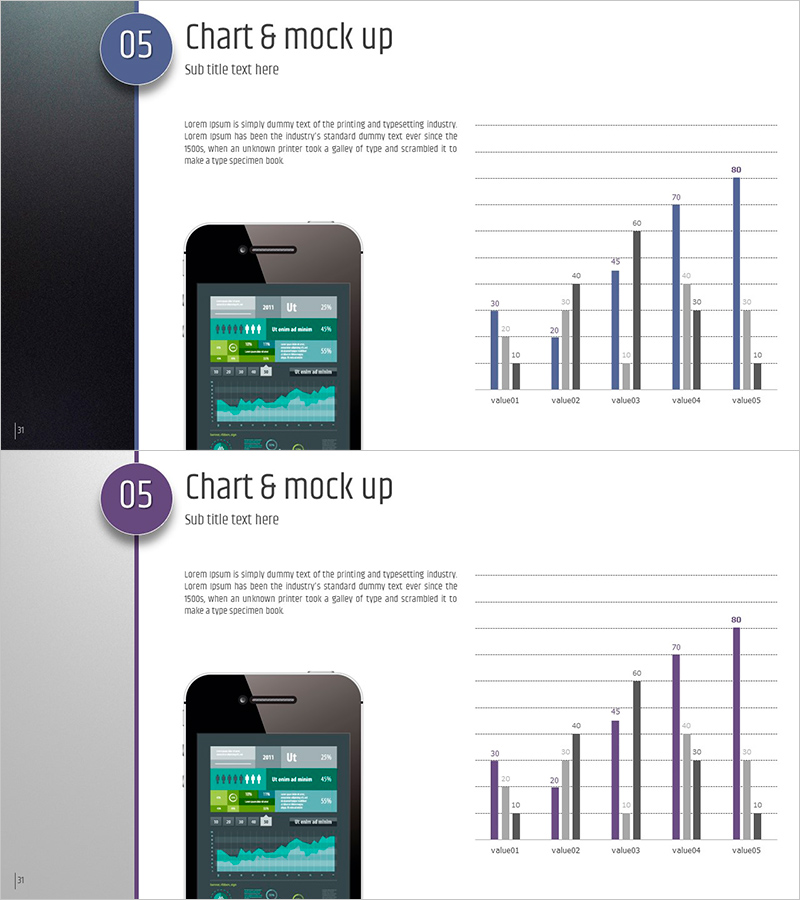
A professional PowerPoint slide set combining smartphone device mockup with 5-color horizontal bar charts for data comparison. This 2-slide template is optimized for app performance analysis, mobile service statistics, and user data presentations. The horizontal bar graph displays five data points in navy blue, purple, and gray tones, while the left-side smartphone mockup provides space to insert app UI screenshots. Created in 16:9 widescreen format, this template is ideal for technology companies, IT startups, and marketing teams presenting performance reports, investor pitches, and product demonstrations.
Usage Points
-
Main Usage
This slide visualizes mobile app performance metrics, user statistics, and service data comparisons. The smartphone device mockup on the left displays app UI screenshots or interface designs, while the horizontal bar chart on the right clearly compares five data points. Ideal for technology companies, startups, and marketing teams presenting performance reports and investor pitches.
-
How to Use
Insert app screenshots or UI designs into the left smartphone mockup area, then update the horizontal bar chart data values with your actual statistics. The five colors (navy blue, purple, gray) are pre-assigned to each data category for easy identification. Customize the text fields with metric names, numerical values, and descriptions to match your presentation context.
-
Recommended For
Software and technology companies presenting product performance, mobile app developers sharing user analytics, marketing teams analyzing campaign results, startups pitching to investors, technology consulting firms presenting client analysis, and digital marketing agencies delivering performance reports.
-
Slide Structure
The 2-slide template features a left-aligned smartphone device mockup (black frame with screen insertion area) paired with a right-aligned horizontal bar chart. The chart displays five data categories (value01 through value05) with a numerical scale from 0 to 80 on the horizontal axis. Each bar is color-coded in distinct hues for category differentiation. A title and subtitle text area at the top allows you to specify the slide topic.
Related Products
-

Coverage and Trends Graph – Market Trends and Competitive Analysis
#Market and Competitor Analysis #Graph #Industry Trends
-

Spring Pastel Wide PowerPoint Template Vertical Bar Chart
#Market and Competitor Analysis #Graph #Industry Trends
-

Business Analysis Chart – Visualizing Competitive Advantage
#Market and Competitor Analysis #Graph #Other
-

3D Stacked Bar Breakdown - Market and Competitor Analysis
#Market and Competitor Analysis #Graph #Industry Trends
