3D Stacked Bar Breakdown - Market and Competitor Analysis
RB0800059_5
- Last Update 03/27/2025
- File Size 0.4MB
- # of Slides 2
- File Format PPTX
- Slide Ratio 4:3
- Color
Keywords
- #Content-Based Slides
- #Design-Based Slides
- #Market and Competitor Analysis
- #Graph
- #Industry Trends
- #Competitive Advantage
- #Column
- #Grouped Column
- #4:3
- #grouped bar chart PowerPoint
- #vertical bar graph slide
- #3-series chart template
- #market analysis PPT
- #competitor comparison slide
- #data visualization PowerPoint
About the Product
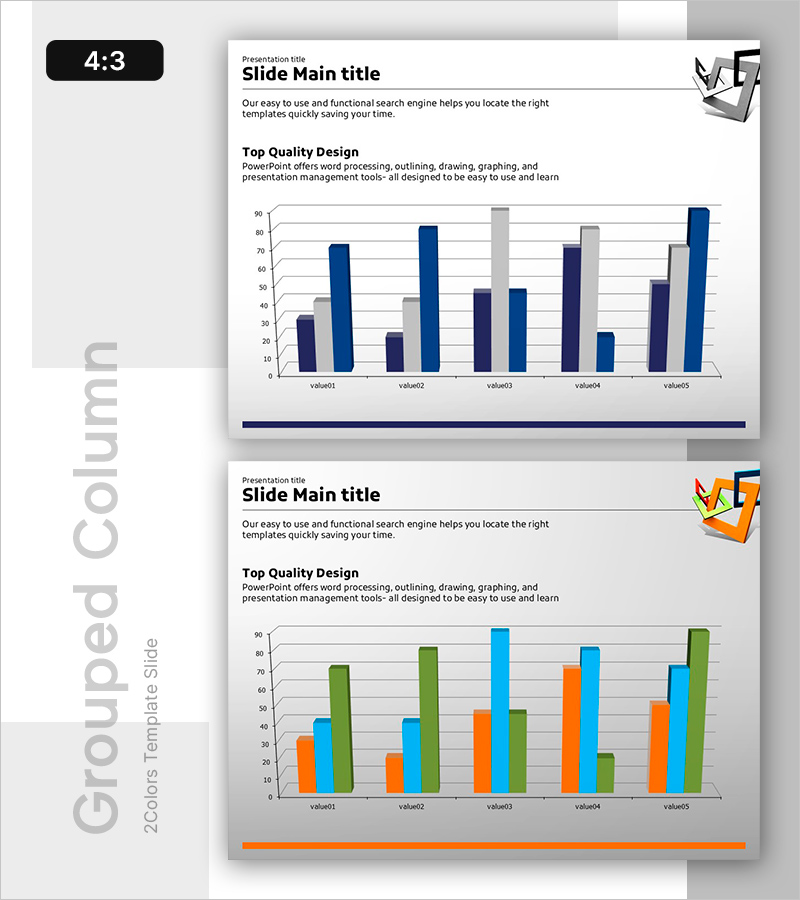
A grouped vertical bar chart PowerPoint slide designed for market analysis and competitor comparison with 3 data series. This slide template displays 5 items across 3 data categories simultaneously, optimized for numerical comparison and trend analysis. The color scheme features dark blue, gray, and light blue bars for clear data differentiation. Perfect for business presentations, reports, and proposals to visualize competitive analysis, market share, performance benchmarks, and strategic comparisons in your PPT deck.
Usage Points
-
Main Usage
Compare and analyze 3 or more data series across 5 items simultaneously. This slide clearly visualizes multiple datasets such as market size, competitor performance, and product metrics to support data-driven decision-making.
-
How to Use
Insert your numerical data into the chart fields in the market analysis or competitive analysis section of your presentation. The bar heights and colors adjust automatically, allowing you to reuse this template for various comparison analyses by simply updating the data.
-
Recommended For
Ideal for marketing plans, business proposals, investor pitch decks, management reports, and strategy presentations. Recommended for marketing professionals, business analysts, planners, executives, and data analysts presenting competitive positioning, market share, performance metrics, and product comparisons.
-
Slide Structure
2-slide template with title and description area at the top, and a grouped vertical bar chart at the bottom displaying 5 items (value01–value05) with 3 data series. Formatted in 4:3 aspect ratio PPTX with dark blue, gray, and light blue color scheme for clear series differentiation.
Related Products
-

Coverage and Trends Graph – Market Trends and Competitive Analysis
#Market and Competitor Analysis #Graph #Industry Trends
-

Five Color Powerpoint Template Wide – Charts and Mockups
#Market and Competitor Analysis #Graph #Other
-

Graph Slide Visualizing Changes in Divorce Numbers
#Market and Competitor Analysis #Graph #Text Box
-

Spring Pastel Wide PowerPoint Template Vertical Bar Chart
#Market and Competitor Analysis #Graph #Industry Trends
