Spring Pastel Wide PowerPoint Template Vertical Bar Chart
RJ0200063_14
- Last Update 04/16/2025
- File Size 2.2MB
- # of Slides 2
- File Format PPTX
- Slide Ratio 16:9
- Color
Keywords
About the Product
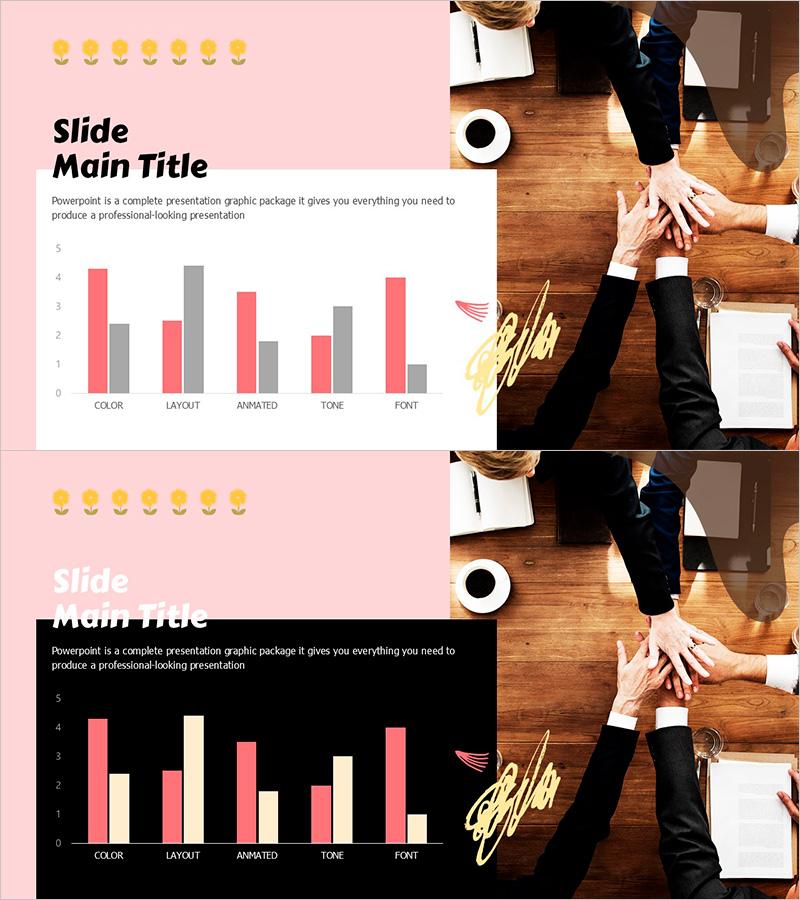
A vertical bar chart PowerPoint slide featuring warm spring pastel tones with dual-color data comparison. The design uses pink and gray bar series to visualize numerical values across five categories, with a title and description area on the left and an image section on the right. This 16:9 widescreen 2-slide template is ready for immediate use in market analysis presentations, performance comparisons, survey results, and data-driven business reports.
Usage Points
-
Main Usage
Display quantitative data using a vertical bar chart with two data series represented in pink and gray. The left section accommodates slide titles and explanatory text, while the chart clearly shows comparative values across five categories. Ideal for market analysis, performance metrics, survey findings, and financial reporting.
-
How to Use
Enter your slide title and description in the left text area. Modify the bar heights and colors in the chart to match your data values. Insert relevant images or graphics in the right image section to enhance visual appeal. Maintain the pastel color scheme and font consistency throughout the presentation.
-
Recommended For
Marketing professionals, financial analysts, business planners, sales executives, and consultants presenting data-driven insights. Suitable for quarterly performance reports, market research presentations, executive briefings, and client proposal materials.
-
Slide Structure
Two-slide template with a 40-60 split layout: left section for titles and descriptions, right section for images. The vertical bar chart displays five categories (COLOR, LAYOUT, ANIMATED, TONE, FONT) with dual-color bars (pink and gray) on a 0-5 Y-axis scale. Formatted in 16:9 widescreen for modern presentation environments.
Related Products
-

Five Color Powerpoint Template Wide – Charts and Mockups
#Market and Competitor Analysis #Graph #Other
-

Coverage and Trends Graph – Market Trends and Competitive Analysis
#Market and Competitor Analysis #Graph #Industry Trends
-

Graph Slide Visualizing Changes in Divorce Numbers
#Market and Competitor Analysis #Graph #Text Box
-

3D Stacked Bar Breakdown - Market and Competitor Analysis
#Market and Competitor Analysis #Graph #Industry Trends
