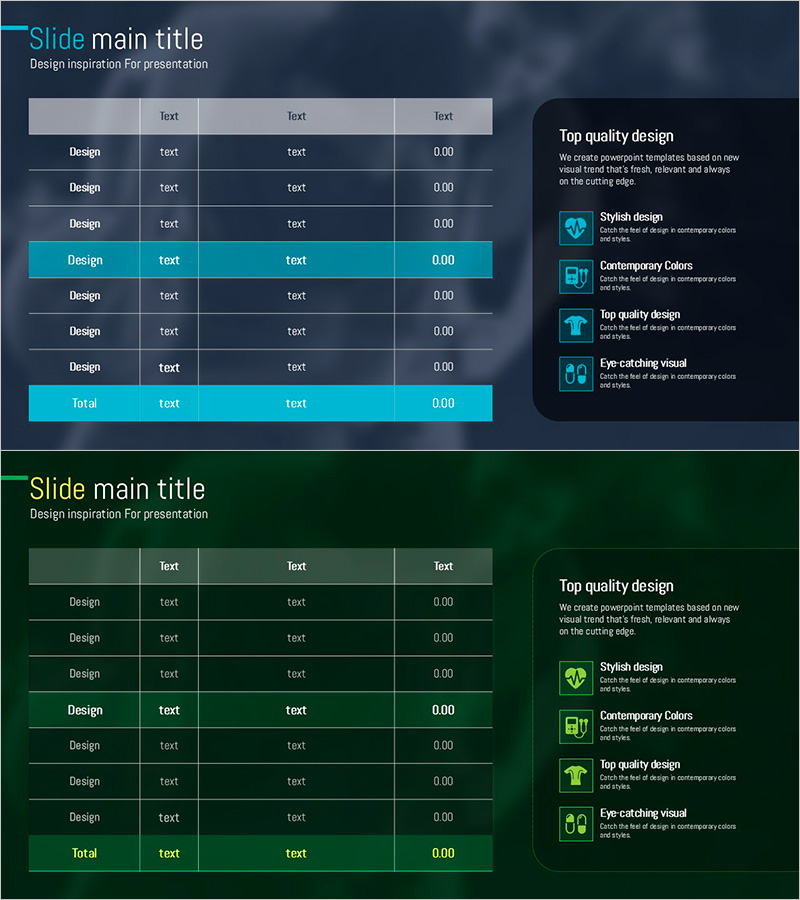
Blue Green Table Slide – Visualizing Financial Performance
RJ0800031_27
- Last Update 08/08/2025
- File Size 2.1MB
- # of Slides 2
- File Format PPTX
- Slide Ratio 16:9
- Color
Keywords
- #Content-Based Slides
- #Design-Based Slides
- #Financial Plans and Performance
- #Diagram
- #Capital Requirements
- #Income Statement
- #Cluster
- #Table
- #Closed Cluster Diagram
- #Standard Table
- #16:9
- #table slide PowerPoint
- #financial data presentation template
- #horizontal table template
- #performance comparison slide
- #table diagram PowerPoint
About the Product
A horizontal table PowerPoint slide designed to clearly organize financial performance and business metrics. Built on a dark navy background with cyan-colored highlight rows, this presentation template enables quick comparison of numerical data and line items at a glance. The 2-slide set allows flexible representation of various financial information, with each cell fully editable. Perfect for investor presentations, quarterly earnings reports, and data-driven business briefings that require immediate deployment.
Usage Points
-
Main Usage
Systematically arrange and compare numerical data such as financial status, quarterly performance, and business KPIs. The dark navy background with cyan highlight rows visually emphasizes critical information in a professional tone.
-
How to Use
Deploy in investor presentations, executive briefings, quarterly earnings reports, and business plan reviews to present financial figures and KPIs in tabular format. Simply replace cell text and numbers with your own data for immediate use.
-
Recommended For
CFOs, finance managers, executives, business development teams, and investor relations professionals presenting quarterly results, budget status, revenue trends, cost analysis, and other financial metrics.
-
Slide Structure
8-row × 4-column horizontal table layout. Header row in light gray, data rows in dark navy, and highlight rows in cyan for visual distinction. Two-slide set accommodates diverse financial information representation.
Related Products
-

Income Statement Table – Clearly Presenting Financial Plans and Performance
#Financial Plans and Performance #Diagram #Income Statement
-

Key Financial Indicators Table – Essential Information Visualization
#Financial Plans and Performance #Diagram #Income Statement
-

Green Brown Analysis Table – Visualizing Financial Planning
#Financial Plans and Performance #Diagram #Capital Requirements
-

Auto Business Funding Table – Maximizing Financial Efficiency
#Financial Plans and Performance #Diagram #Capital Requirements
