Green Brown Analysis Table – Visualizing Financial Planning
RJ0900032_25
- Last Update 08/26/2025
- File Size 0.8MB
- # of Slides 2
- File Format PPTX
- Slide Ratio 16:9
- Color
Keywords
- #Content-Based Slides
- #Design-Based Slides
- #Financial Plans and Performance
- #Diagram
- #Capital Requirements
- #Income Statement
- #Table
- #Standard Table
- #16:9
- #financial analysis table PowerPoint
- #data table slide template
- #profit and loss statement PPT
- #financial planning presentation
- #business data visualization slides
- #financial report template download
About the Product
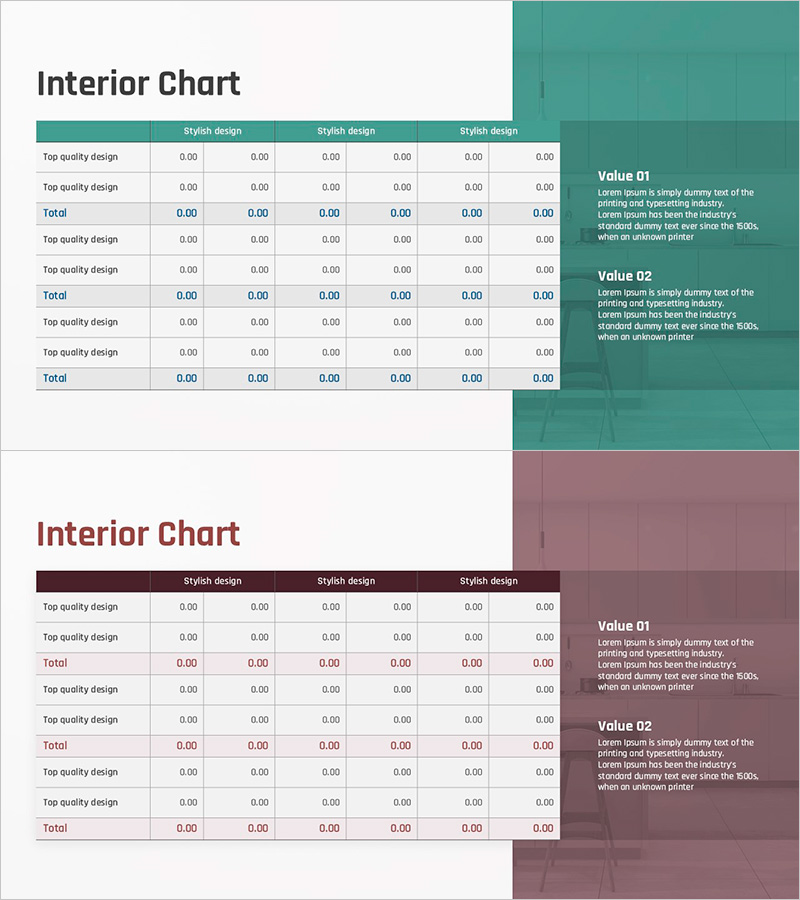
A 2-slide financial analysis table PowerPoint template designed for financial planning and profit-loss visualization. The slides feature a dual-tone color scheme combining green and brown tones, with a 6-column data table structure supporting multiple rows for comprehensive data entry. Each slide is divided into a left data table section and a right-side explanation box, enabling simultaneous presentation of numerical data and analytical insights. Available in 16:9 widescreen PPTX format for immediate editing. Ideal for financial reports, business plans, quarterly performance presentations, and investor-facing documents.
Usage Points
-
Main Usage
Systematically organize and visualize financial data and analysis results. Effectively present income statements, financial ratio analysis, quarterly performance comparisons, budget versus actual reports, and other numerical information in a clear tabular format.
-
How to Use
Enter financial figures into the table cells and add analytical commentary in the right-side explanation box. Use green and brown colors to distinguish categories or represent positive and negative indicators. Customize header row text to match your specific data categories and requirements.
-
Recommended For
Ideal for CFOs, finance managers, executives, and investor presentations. Suitable for business plan financial sections, quarterly management reports, investor pitch decks, internal financial analysis meetings, and corporate performance reviews.
-
Slide Structure
2-slide set with dual-layout design. Each slide features a left-aligned 6-column data table (3-5 data rows plus totals row) paired with a right-side explanation box in green or brown background. Header row uses color emphasis for clarity; data cells have white background for readability. 16:9 widescreen format.
Related Products
-

Auto Business Funding Table – Maximizing Financial Efficiency
#Financial Plans and Performance #Diagram #Capital Requirements
-

Blue Green Table Slide – Visualizing Financial Performance
#Financial Plans and Performance #Diagram #Capital Requirements
-

Green Purple Funding Plan Table – Highlighting Financial Effectiveness
#Financial Plans and Performance #Diagram #Capital Requirements
-

Donut Chart Analysis and Table – Simple Data Visualization
#Financial Plans and Performance #Diagram #Graph
