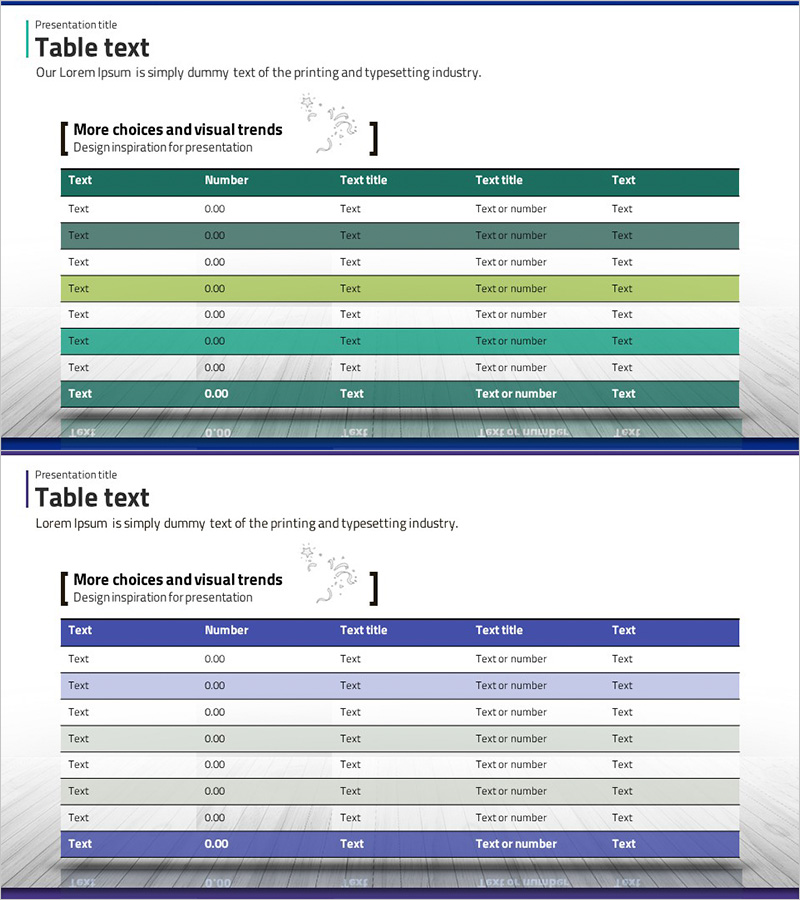
Green Purple Funding Plan Table – Highlighting Financial Effectiveness
RJ0300010_15
- Last Update 04/20/2025
- File Size 1.8MB
- # of Slides 2
- File Format PPTX
- Slide Ratio 16:9
- Color
Keywords
- #Content-Based Slides
- #Design-Based Slides
- #Financial Plans and Performance
- #Diagram
- #Capital Requirements
- #Income Statement
- #Table
- #Standard Table
- #16:9
- #financial plan table PowerPoint
- #budget allocation slide template
- #funding plan PPT
- #financial data table presentation
- #editable table PowerPoint slide
About the Product
A 5-row data table PowerPoint slide designed to present financial information with clarity and structure. The header row features a green and purple dual-tone accent, while alternating row backgrounds (green, lime, white) enhance data readability and visual hierarchy. Ideal for funding plans, budget allocation, cost analysis, and financial effectiveness comparisons in presentations. The 2-slide set provides flexible table layouts that are fully editable—simply input your data, adjust cell content, and customize colors as needed. Perfect for business plans, investor pitches, financial reports, and strategic presentations.
Usage Points
-
Main Usage
Present financial data in a structured, easy-to-read table format. This slide is designed for funding plans, budget breakdowns, cost analysis, revenue comparisons, and financial effectiveness assessments. The dual-tone header and alternating row colors create clear visual hierarchy, making numerical data immediately comprehensible to your audience.
-
How to Use
Use this table slide in business plans, investor presentations, financial reports, quarterly reviews, and budget planning meetings. Simply replace placeholder text with your actual figures, add or remove rows as needed, and adjust colors to match your brand. The template supports numbers, currency symbols, percentages, and text entries.
-
Recommended For
CFOs, financial analysts, business planners, marketing managers, consultants, and project managers who need to communicate quantitative data. Ideal for financial reviews, budget presentations, investment committee meetings, executive reports, and stakeholder communications.
-
Slide Structure
2-slide set featuring two table layout variations. Each slide contains a 5-row × 5-column data table with a dual-tone header row (green & purple) and alternating data row backgrounds (green, lime, white). Optimized for 16:9 widescreen format with fully editable cells and formatting.
Related Products
-

Auto Business Funding Table – Maximizing Financial Efficiency
#Financial Plans and Performance #Diagram #Capital Requirements
-

Green Brown Analysis Table – Visualizing Financial Planning
#Financial Plans and Performance #Diagram #Capital Requirements
-

Blue Green Table Slide – Visualizing Financial Performance
#Financial Plans and Performance #Diagram #Capital Requirements
-

Financial Indicators and Profit and Loss Statements Slide – Visualized in Blue and Green
#Financial Plans and Performance #Diagram #Income Statement
