Key Financial Indicators Table – Essential Information Visualization
RJ0300050_18
- Last Update 05/01/2025
- File Size 1.4MB
- # of Slides 2
- File Format PPTX
- Slide Ratio 16:9
- Color
Keywords
- #Content-Based Slides
- #Design-Based Slides
- #Financial Plans and Performance
- #Diagram
- #Income Statement
- #Key Financial Indicators
- #Cluster
- #Table
- #Closed Cluster Diagram
- #Standard Table
- #16:9
- #financial indicators table PowerPoint
- #financial data comparison slide
- #business metrics template
- #financial analysis presentation
- #data table slide design
About the Product
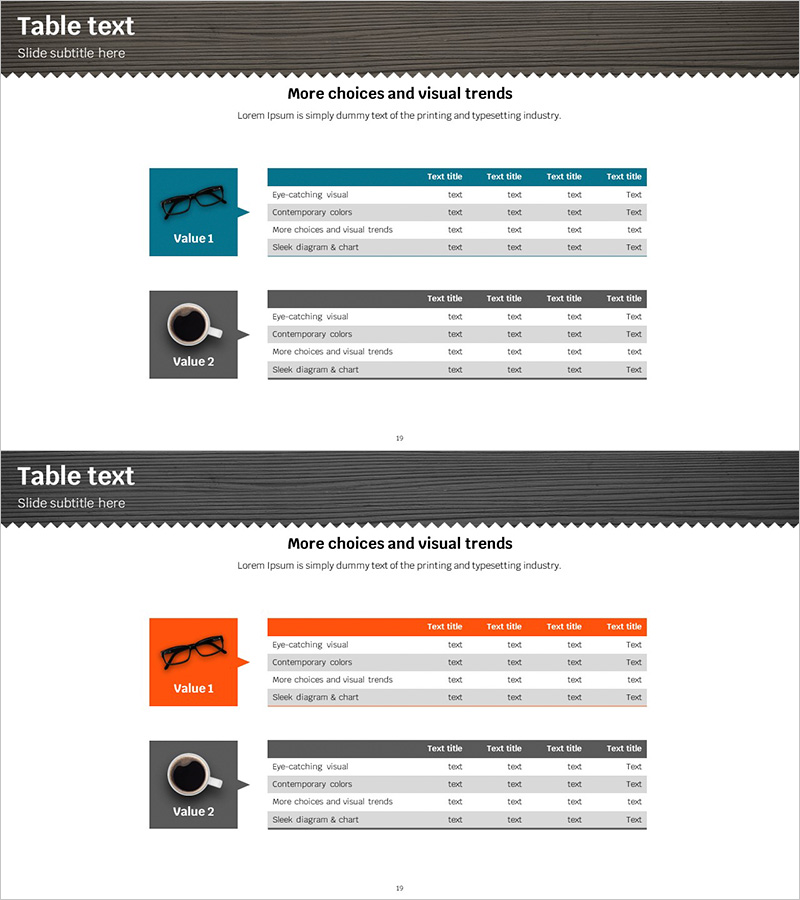
A 2-slide PowerPoint presentation designed to clearly communicate financial performance through structured table layouts. The slides feature contrasting teal and gray header backgrounds with 4-column table structures that enable effective comparison of key financial metrics. Visual icons—eyeglasses and coffee cup—serve as focal points, while row-based information segmentation enhances readability. Each table organizes data in a clean grid format, making it ideal for investor reports, financial analysis presentations, and executive briefings.
Usage Points
-
Main Usage
Organizes financial metrics, KPIs, and budget items in a matrix structure for comparative analysis. The 4-column table layout enables quick assessment of figures across time periods, departments, or categories, building investor confidence through professional data presentation.
-
How to Use
Deploy in financial reports, quarterly earnings presentations, and investor briefings to summarize key performance indicators. Input metric names in rows and corresponding values, ratios, or targets in columns to clearly communicate financial trends. Color differentiation can highlight priority or variance levels.
-
Recommended For
CFOs, finance managers, executives, and investor relations professionals presenting financial performance. Suitable for earnings calls, investor conferences, bank loan negotiations, private equity pitches, and internal management meetings requiring financial status updates.
-
Slide Structure
Two-slide set with header area (title and subtitle) plus 4-column data table on each slide. Slide 1 features teal header with eyeglasses icon; Slide 2 has gray header with coffee cup icon for visual variety. Each table contains 4 columns and 4–5 rows for organized metric display.
Related Products
-

Income Statement Table – Clearly Presenting Financial Plans and Performance
#Financial Plans and Performance #Diagram #Income Statement
-

Fashion Business Profit and Loss Table - Financial Performance and Strategy
#Financial Plans and Performance #Diagram #Income Statement
-

Sales and Profit Table – Statistical Financial Performance
#Financial Plans and Performance #Diagram #Sales and Revenue
-

Modern Styled Table Chart for Data Visualization – Clarity and Precision
#Financial Plans and Performance #Diagram #Income Statement
