Auto Business Funding Table – Maximizing Financial Efficiency
RB0700027_7
- Last Update 03/16/2025
- File Size 2MB
- # of Slides 2
- File Format PPTX
- Slide Ratio 4:3
- Color
Keywords
- #Content-Based Slides
- #Design-Based Slides
- #Financial Plans and Performance
- #Diagram
- #Capital Requirements
- #Income Statement
- #Table
- #Standard Table
- #4:3
- #data table PowerPoint slide
- #financial analysis template
- #4-column table design
- #profit and loss statement PPT
- #funding plan slide
- #comparison table template
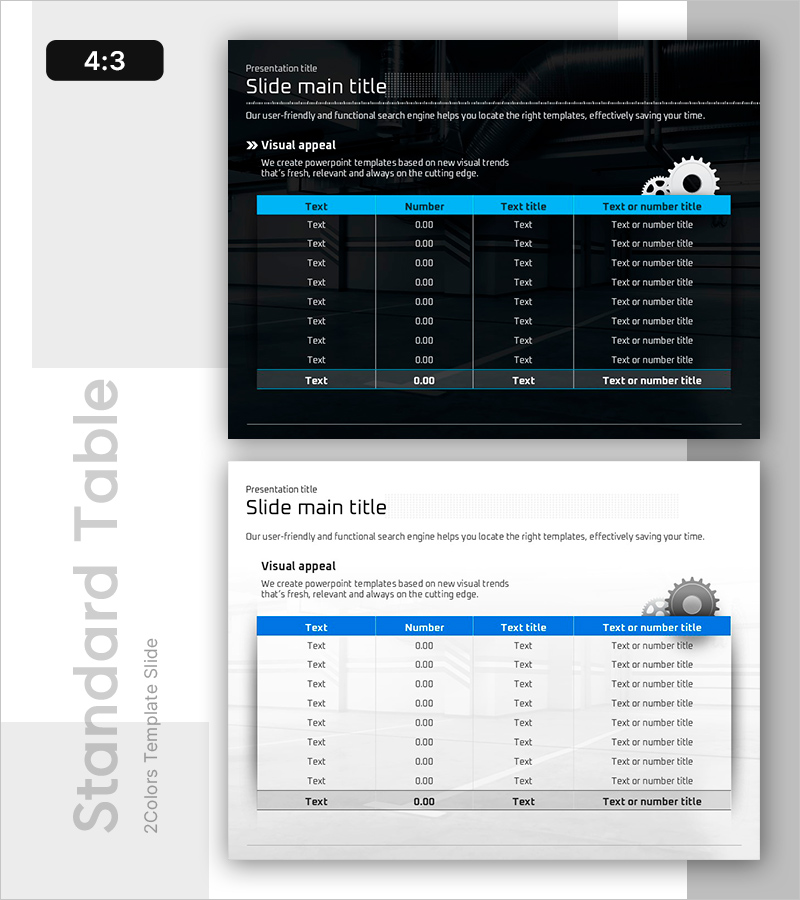
About the Product
A PowerPoint table slide optimized for automotive business funding plans and financial analysis. The design features a dark background with a bright blue header for high contrast, making numbers and text information stand out clearly. The 4-column structure (text, number, title, description) is ideal for organizing diverse financial data such as profit-and-loss statements, capital requirements, and financial efficiency analysis. Ready to use in presentations with fully editable colors and cell dimensions.
Usage Points
-
Main Usage
Organize and compare financial data, profit-and-loss statements, capital requirements, and cost items in a structured table format. Ideal for funding plan and financial efficiency presentations in automotive, manufacturing, and finance sectors.
-
How to Use
Input text, numbers, titles, and descriptions into the 4-column structure. The blue header stands out against the dark background, so place key items at the top and use the highlighted bottom row for subtotals or grand totals for maximum visual impact.
-
Recommended For
CFOs, finance managers, business planners, and investment professionals presenting funding plans, budget analysis, and cost structure explanations. Recommended for automotive industry, manufacturing, and startup investor pitch decks.
-
Slide Structure
2-slide deck (4:3 aspect ratio) featuring a 4-column table (text, number, title, description) with 9 data rows plus 1 summary row per slide. Dark background with bright blue header row, white text, and gray dividers create clear information hierarchy.
Related Products
-

Green Purple Funding Plan Table – Highlighting Financial Effectiveness
#Financial Plans and Performance #Diagram #Capital Requirements
-

Blue Green Table Slide – Visualizing Financial Performance
#Financial Plans and Performance #Diagram #Capital Requirements
-

Green Brown Analysis Table – Visualizing Financial Planning
#Financial Plans and Performance #Diagram #Capital Requirements
-

Table of Contents for Profit Achievement – Visualizing Financial Plans
#Financial Plans and Performance #Diagram #Balance Sheet
