Blue Green Graph Numerical Change Analysis – Ideal for Market and Competitive Analysis Presentation
RJ0800031_23
- Last Update 08/08/2025
- File Size 0.7MB
- # of Slides 2
- File Format PPTX
- Slide Ratio 16:9
- Color
Keywords
- #Content-Based Slides
- #Design-Based Slides
- #Market and Competitor Analysis
- #Diagram
- #Graph
- #Competitor Analysis
- #Competitive Advantage
- #Cluster
- #Horizontal Bar
- #Closed Cluster Diagram
- #Grouped Horizontal Bar
- #16:9
- #horizontal bar chart PowerPoint
- #data comparison slide template
- #market analysis chart
- #competitive analysis PowerPoint
- #how to create bar chart in PowerPoint
About the Product
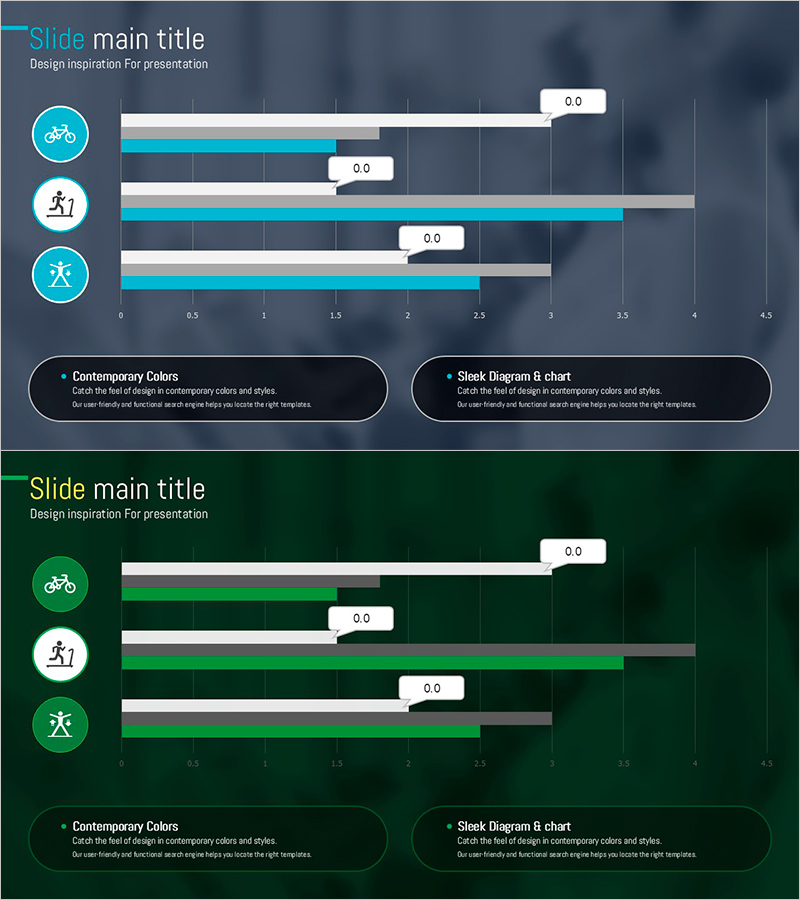
A horizontal bar chart PowerPoint slide optimized for market analysis and competitive comparison. The design features a dark background with cyan accent bars and gray comparison bars to clearly visualize numerical changes. Category icons (bicycle, exercise, health) represent each item, with value labels (0.0 format) for precise data communication. The 2-slide 16:9 format is ready for immediate use in presentations and reports, with fully editable colors and values.
Usage Points
-
Main Usage
Compares numerical data across three items such as market size, competitor performance, or departmental results. The contrast between cyan and gray bars clearly distinguishes primary metrics from comparison targets, while value labels ensure accurate data presentation.
-
How to Use
Use in executive reports, quarterly performance presentations, and market research sharing. Adjust bar lengths and colors to match your data, and customize icons and category labels for various comparative analyses.
-
Recommended For
Ideal for marketing teams presenting market analysis, sales teams comparing competitors, executive reports, consulting proposals, and business plans. Suitable for any presentation requiring intuitive visualization of quantitative data.
-
Slide Structure
2-slide set. Each slide contains a 3-item horizontal bar chart with icons (bicycle, exercise, health) on the left, gray baseline bars in the center, cyan accent bars on the right, and value labels (0.0). Dark background with bright text provides clear contrast.
Related Products
-

Carbon Neutral Competitive Advantage Horizontal Chart
#Market and Competitor Analysis #Graph #Competitor Analysis
-

Annual Investment Analysis Graph – Competitor Analysis and Cluster Visualization
#Market and Competitor Analysis #Diagram #Graph
-

Competitive Comparison Silhouette Diagram – A Strategic Analysis Tool
#Market and Competitor Analysis #Diagram #Competitor Analysis
-

Comparison Diagram of Architectural Structures – Market Competition Analysis
#Market and Competitor Analysis #Diagram #Competitor Analysis
