Comparison Diagram of Architectural Structures – Market Competition Analysis
RJ0300034_15
- Last Update 04/27/2025
- File Size 6.5MB
- # of Slides 2
- File Format PPTX
- Slide Ratio 16:9
- Color
Keywords
- #Content-Based Slides
- #Design-Based Slides
- #Market and Competitor Analysis
- #Diagram
- #Competitor Analysis
- #Competitive Advantage
- #Cluster
- #Closed Cluster Diagram
- #16:9
- #comparison diagram PowerPoint
- #2-item cluster slide
- #competitive analysis template
- #contrast diagram
- #diagram PowerPoint slide design
About the Product
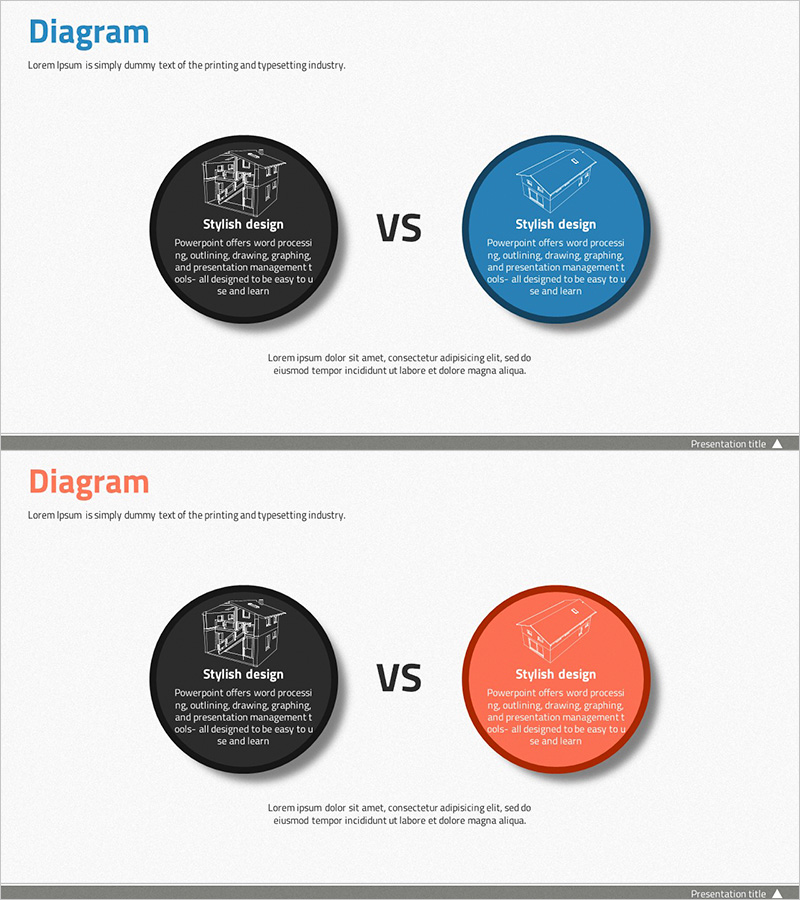
A circular cluster diagram PowerPoint slide for comparing two items side by side. The design features a black circle on the left and a blue circle on the right, separated by a 'VS' symbol, making it ideal for competitive analysis, product comparison, and market positioning. Each circle includes an icon area and text space for describing features, advantages, and differences. The 16:9 widescreen format with 2 slides is ready for immediate use in presentations.
Usage Points
-
Main Usage
Visually compare and analyze two subjects such as competitors, products, strategies, or teams by highlighting their features, advantages, and differences. The circular cluster structure provides equal emphasis on both items, making it ideal for objective comparative analysis.
-
How to Use
Enter comparison details in the icon area and text boxes within each circle. Freely edit colors, text, and icons to adapt the slide for competitive analysis, product comparison, marketing positioning, organizational culture comparison, and other presentation scenarios.
-
Recommended For
Marketing and sales professionals presenting competitive analysis, product planning teams showcasing product comparisons, executives reporting market positioning, and consultants presenting comparative analysis in proposal documents.
-
Slide Structure
2-slide set. Each slide features a black circle (left) and a blue or coral circle (right) separated by a 'VS' symbol. Icon areas and text input spaces within each circle allow for detailed item descriptions.
Related Products
-

Card Competitor Comparison Slide Template – Competitive Advantage Analysis
#Market and Competitor Analysis #Diagram #Competitor Analysis
-

Business Competitive Advantage Analysis Graph – Differentiation in the Market
#Market and Competitor Analysis #Diagram #Graph
-

Business Program Analysis Area Graph – Competitive Edge
#Market and Competitor Analysis #Diagram #Graph
-

Mobile Service Technology Analysis Graph – Market and Competitor Analysis
#Market and Competitor Analysis #Diagram #Graph
