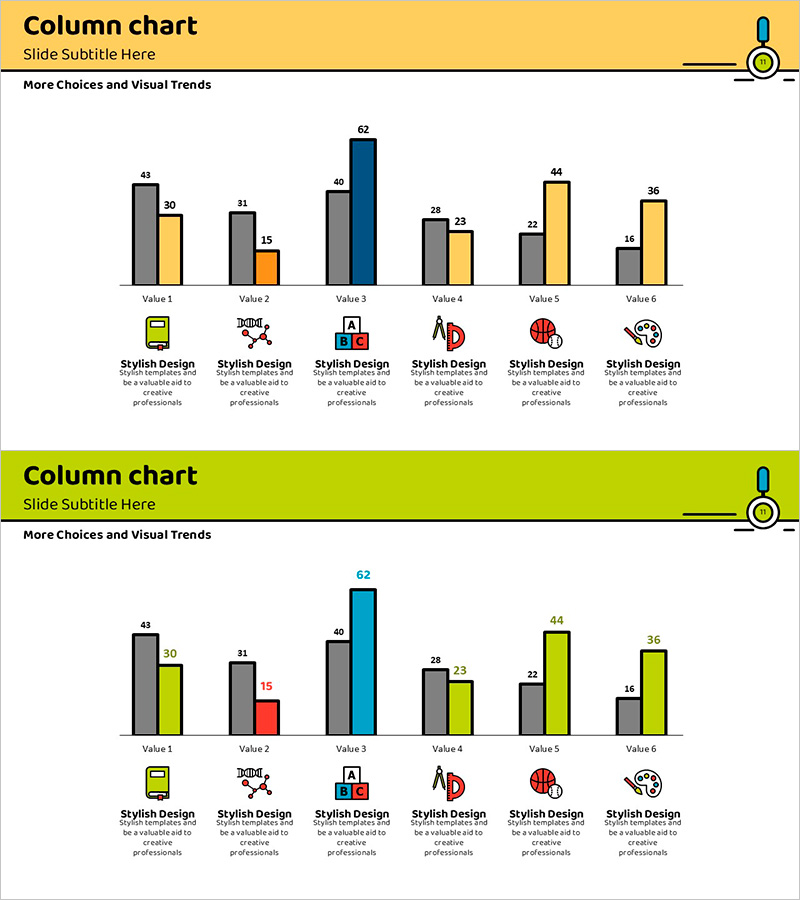
Bundled Bar Chart by Subject – Visualizing Competitive Advantages
RJ0500012_10
- Last Update 06/10/2025
- File Size 0.5MB
- # of Slides 2
- File Format PPTX
- Slide Ratio 16:9
- Color
Keywords
About the Product
A grouped bar chart PowerPoint slide comparing 6 items across 2 data series using gray, orange, blue, and yellow color schemes. Ideal for competitive analysis, quarterly performance comparison, and product feature benchmarking in business presentations and reports. Each item includes an icon and descriptive text below the chart for immediate use. The 2-slide set features two design variations with different header colors (yellow and lime green) for flexible section differentiation.
Usage Points
-
Main Usage
Enables simultaneous comparison of multiple items across 2 or more data series to highlight relative advantages, performance differences, and competitive positioning at a glance. Perfect for executive briefings, marketing strategy presentations, and product performance comparisons requiring complex data clarity.
-
How to Use
Input numerical values for each item and series; bar heights adjust automatically. Modify header color to differentiate sections or adjust series colors to match brand guidelines. Edit icons and descriptive text to reflect specific item names and categories.
-
Recommended For
Executives, marketing teams, sales professionals, and analysts presenting quarterly results, product feature comparisons, competitive benchmarking, and customer satisfaction metrics. Suitable for business plans, performance reports, proposals, and marketing strategy documents.
-
Slide Structure
2-slide set with consistent layout: colored header bar (yellow or lime green), centered grouped bar chart with 6 items and 2 data series in multiple colors, and bottom section with 6 icons plus descriptive text. Optimized for 16:9 widescreen format.
Related Products
-

Mobile Service Analysis Graph – Visualizing Market Competitiveness
#Market and Competitor Analysis #Diagram #Graph
-

High Quality Gradient Bar Graph – Market and Competitor Analysis
#Market and Competitor Analysis #Graph #Market Analysis
-

Layout Design Presentation Template for Market & Competitor Analysis – Column Chart
#Market and Competitor Analysis #Graph #Customer Analysis
-

Office Interior Analysis Graph - Visualizing Competitive Advantage
#Market and Competitor Analysis #Graph #Market Analysis
