Effective Physical Strength Management - Performance Growth Visualization
RJ0800021_27
- Last Update 08/29/2025
- File Size 0.1MB
- # of Slides 2
- File Format PPTX
- Slide Ratio 16:9
- Color
Keywords
- #Content-Based Slides
- #Design-Based Slides
- #Technical Approach
- #Market and Competitor Analysis
- #Graph
- #Other
- #Service Operation Plan
- #Competitive Advantage
- #Column
- #Grouped Column
- #16:9
- #clustered bar chart PowerPoint
- #annual performance comparison slide
- #4-series data visualization
- #performance analysis PPT template
- #bar graph PowerPoint slide design
About the Product
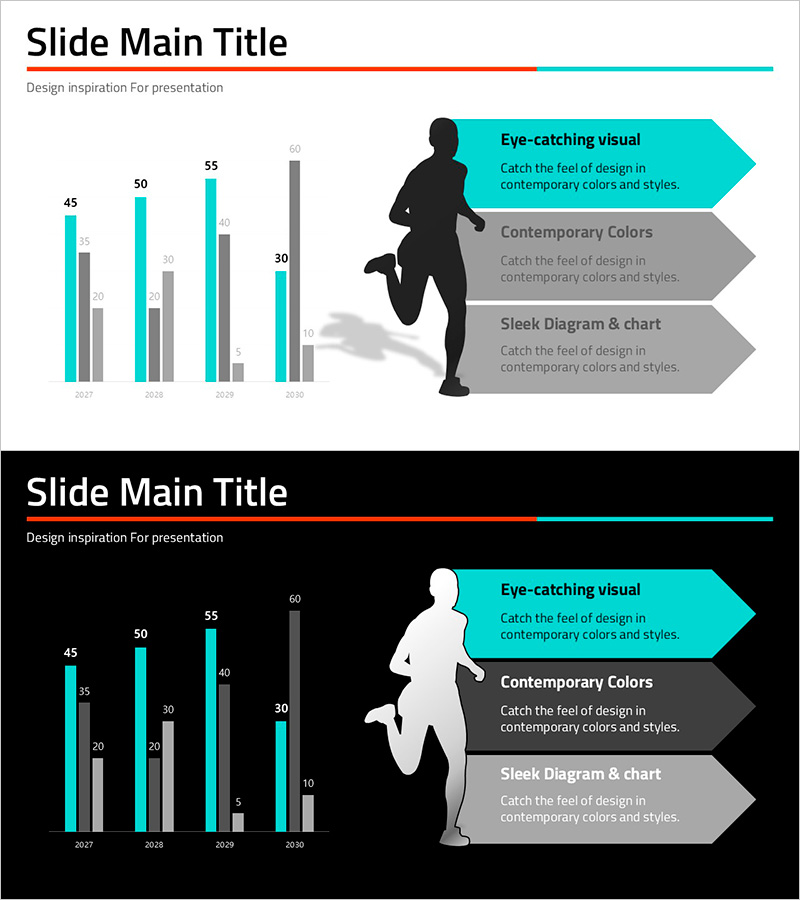
A clustered bar chart PowerPoint slide designed for comparing annual performance data across multiple years and metrics. This presentation template visualizes data from 2027 to 2030 using 4 data series, with turquoise and gray color contrast to distinguish primary and secondary indicators. The slide combines a left-side clustered bar graph with three right-side arrow-shaped callout boxes to deliver both quantitative analysis and key insights simultaneously. Ideal for business performance reports, growth strategy presentations, and data-driven decision-making in corporate, marketing, and operational contexts.
Usage Points
-
Main Usage
Compare performance metrics across multiple years or periods using 4 or more data series. Effectively visualize trends in revenue, customer satisfaction, productivity, and efficiency simultaneously to highlight performance differences and strategic insights.
-
How to Use
Input actual data into the left-side clustered bar graph and write key insights in the right-side arrow-shaped callout boxes. All colors and numerical values are fully editable. The graph structure can be expanded to accommodate additional data series or time periods as needed.
-
Recommended For
Executive reports, quarterly performance presentations, business planning sessions, marketing performance analysis, HR evaluation materials, and investor pitch decks. Recommended for professionals including executives, business analysts, planners, marketers, and data-driven decision makers.
-
Slide Structure
The 2-slide template features a clustered bar graph on the left (4 series × 4 years = 16 data points) paired with three turquoise arrow-shaped callout boxes on the right. Title and subtitle areas are positioned at the top, with background options in light gray or black for visual contrast and professional presentation.
Related Products
-

Five Color Powerpoint Template Wide – Charts and Mockups
#Market and Competitor Analysis #Graph #Other
-

The Importance of Modern People's Health Care – Insights from Market Analysis
#Market and Competitor Analysis #Graph #Other
-

Bundled Graphs and Maps for Business Plan Visualization
#Market and Competitor Analysis #Graph #Other
-

Chart of Change in Sales by Country – Market Analysis and Competitive Advantage
#Market and Competitor Analysis #Graph #Other
