Visualizing the Changing Trend of the Ageing Population with a 100% Stacked Bar Graph
RJ0600001_12
- Last Update 06/21/2025
- File Size 0.2MB
- # of Slides 2
- File Format PPTX
- Slide Ratio 16:9
- Color
Keywords
- #Content-Based Slides
- #Design-Based Slides
- #Business Strategy
- #Market and Competitor Analysis
- #Marketing Plan and Strategy
- #Graph
- #Other
- #Financial Outlook & Expected Impact
- #Future Outlook
- #Market Analysis
- #Positioning
- #Column
- #Segmented Column
- #Silhouette
- #16:9
- #100% stacked bar chart
- #population statistics PowerPoint
- #demographic trend graph
- #proportion comparison slide
- #cumulative bar chart template
About the Product
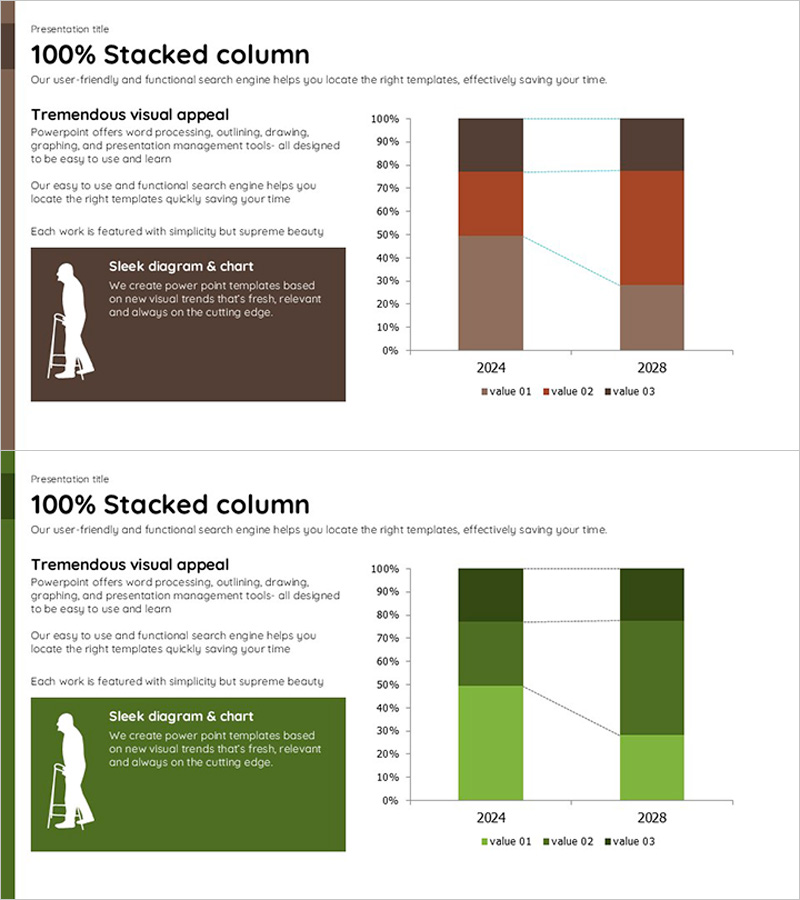
A 100% stacked bar chart PowerPoint slide designed to visualize the changing trend of the ageing population over time. This presentation template displays data from 2024 and 2028 across three value categories (value 01, 02, 03), clearly showing proportional shifts in demographic composition. The brown and orange color scheme reinforces the credibility of population statistics, while connecting lines emphasize the trend across time periods. The 2-slide set includes an identical layout version in green tones, allowing you to select colors that match your presentation theme or organizational branding. Ready to use for demographic analysis, social policy presentations, government reports, and data-driven discussions on population aging.
Usage Points
-
Main Usage
Ideal for presenting demographic statistics, social trends, and policy analysis where proportional changes over time need clear visualization. The 100% stacked format simultaneously conveys composition ratios and overall shifts, with connecting lines highlighting key trends.
-
How to Use
Input your actual data directly into the slide for immediate use. Select either the brown-orange or green version to match your presentation theme and organizational colors, then edit the legend and values to create a customized chart.
-
Recommended For
Demographic researchers, social policy officials, healthcare institutions, academic presenters, government agencies, and policy analysts presenting population structure changes, aging trends, and social demographic analysis.
-
Slide Structure
2-slide set featuring 100% stacked bar charts comparing 2024 and 2028 data across three value categories. Each slide includes a 0-100% axis, legend, and connecting lines to emphasize trends. Available in two color versions: brown-orange and green tones.
Related Products
-

Cartoon Theme Vertical Bar Segmentation Graph – Vision and Growth
#Market and Competitor Analysis #Graph #Future Outlook
-

Graph of Changes in Media Utilization
#Market and Competitor Analysis #Graph #Future Outlook
-

Orange Hexagon Presentation Template Segmented Vertical Bar Graph – Market and Competitive Analysis
#Market and Competitor Analysis #Graph #Other
-

Visualization of Learning Response Data – Market Trend Analysis
#Market and Competitor Analysis #Graph #Future Outlook
