Analyzing Bank Delinquency Rate Trends with Stacked Area Chart
RJ0600077_15
- Last Update 07/10/2025
- File Size 6.5MB
- # of Slides 2
- File Format PPTX
- Slide Ratio 16:9
- Color
Keywords
- #Content-Based Slides
- #Design-Based Slides
- #Business Strategy
- #Market and Competitor Analysis
- #Graph
- #Other
- #Financial Outlook & Expected Impact
- #Future Outlook
- #16:9
- #stacked area chart PowerPoint
- #bank delinquency rate slide
- #financial data visualization PPT
- #trend analysis presentation slide
- #how to create stacked area chart in PowerPoint
About the Product
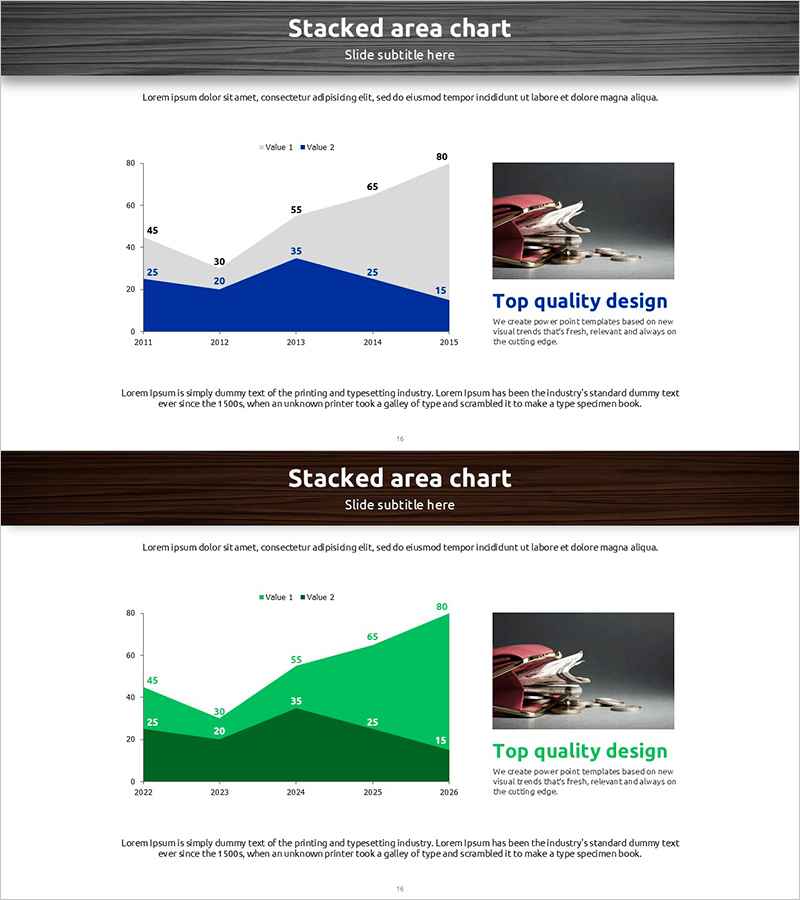
A PowerPoint slide visualizing bank delinquency rate trends using a stacked area chart. Data spanning 2011 to 2015 is presented across two series (Value 1 and Value 2), with navy blue and light gray layers creating clear information hierarchy. The right side features an image placeholder and text description area, enabling rich contextual presentation. This slide is optimized for financial institutions, banking sector reports, investor presentations, and executive briefings where trend data must be communicated with precision and visual impact.
Usage Points
-
Main Usage
Presents time-series financial data such as delinquency rates, non-performing loans, and credit risk metrics across multiple categories. The stacked area structure simultaneously displays overall magnitude and individual series trends, making it ideal for financial analysis, risk management presentations, and regulatory reporting.
-
How to Use
Deploy in executive briefings, investor relations presentations (IR), regulatory agency reports, and internal management meetings to explain delinquency rate, default rate, and credit indicator trends. Customize the right-side image and text area with supporting visuals or key insights to strengthen data interpretation and stakeholder confidence.
-
Recommended For
Banking and financial institution finance teams / Credit analysis and risk management departments / Financial consulting firms / Executive and board-level reporting / Investor and creditor presentations / Financial regulatory compliance and reporting teams
-
Slide Structure
Title and subtitle header / Left-side stacked area chart (2011–2015 timeline, two series: Value 1 and Value 2, navy and light gray layers) / Right-side image placeholder (4:3 aspect ratio) with text description area (title and body text in two tiers) / Bottom legend and footnote section
Related Products
-

Food Truck Sales Rise Graph - Strong Business Strategy
#Business Strategy #Market and Competitor Analysis #Diagram
-

Visualizing Profit Outlook with Development and Growth Graphs
#Business Strategy #Market and Competitor Analysis #Graph
-

Visualizing the Changing Trend of the Ageing Population with a 100% Stacked Bar Graph
#Business Strategy #Market and Competitor Analysis #Marketing Plan and Strategy
-

Growth Curve Area Graph - Market and Competitive Analysis
#Business Strategy #Market and Competitor Analysis #Graph
