Speed Timer Diagram for Market Share Analysis
RJ0800024_25
- Last Update 08/06/2025
- File Size 1MB
- # of Slides 2
- File Format PPTX
- Slide Ratio 16:9
- Color
Keywords
- #Content-Based Slides
- #Design-Based Slides
- #Market and Competitor Analysis
- #Diagram
- #Graph
- #Market Share
- #Competitive Advantage
- #Cluster
- #Circles
- #Closed Cluster Diagram
- #Doughnut Chart
- #16:9
- #donut timer diagram PowerPoint
- #time comparison slide
- #circular chart presentation
- #market share visualization
- #3-stage timer slide template
About the Product
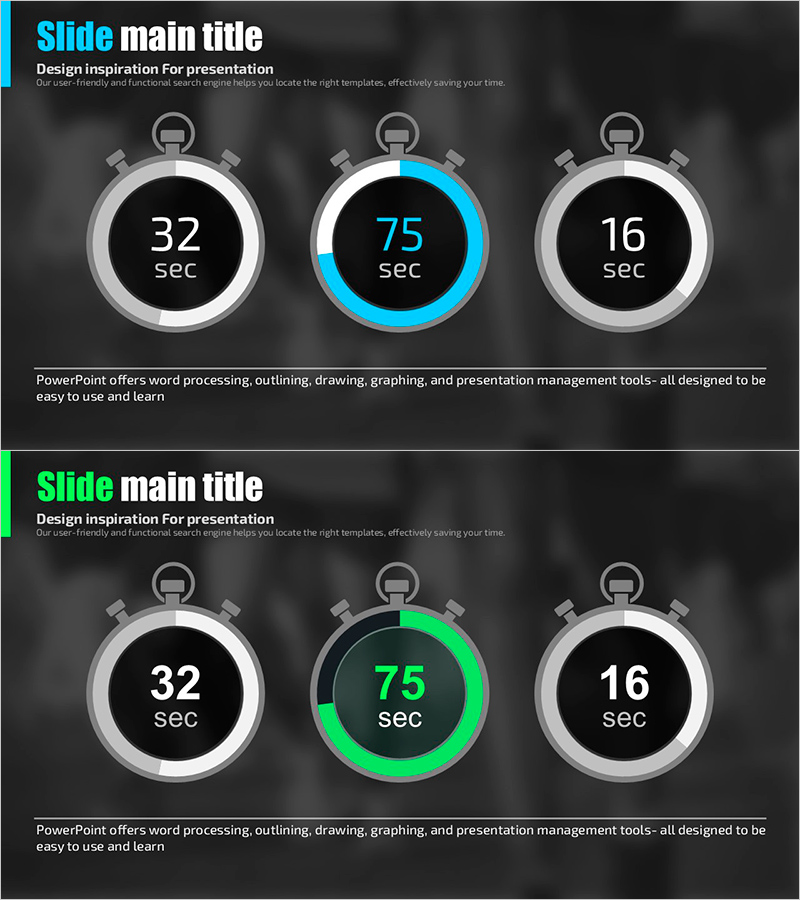
A donut-shaped timer diagram PowerPoint slide optimized for market share analysis and competitive advantage comparison. Three circular timers (32 seconds, 75 seconds, 16 seconds) are displayed on a dark background, with the center timer highlighted in bright blue to emphasize the key metric. Perfect for business presentations, product introductions, and performance reports to visually represent speed comparisons, time allocation, and priority analysis. The 2-slide set includes two color versions—blue and green—in 16:9 widescreen format compatible with all presentation environments. Fully editable with drag-and-drop functionality.
Usage Points
-
Main Usage
Visualizes three metrics simultaneously—market share, competitive comparison, time allocation, and speed analysis—using circular timer shapes. The donut format intuitively represents time progression, completion rates, and proportional relationships, with center accent color highlighting the primary metric.
-
How to Use
Use in sales presentations for competitive advantage analysis, business reports for time distribution status, and marketing strategy meetings for channel share comparison. Double-click timer numbers and labels to edit, and change colors instantly via the Design tab.
-
Recommended For
Sales team competitive analysis presentations, executive reports, marketing strategy meetings, and product development team scheduling presentations. Especially effective when comparing three items simultaneously across different time or performance dimensions.
-
Slide Structure
Three circular timer shapes arranged horizontally on a dark gradient background. The center timer features a blue (or green) accent ring, with each timer containing numeric values and 'sec' text. Title area at top, descriptive text at bottom, and a colored accent bar on the left side for visual emphasis.
Related Products
-

Donut Charts of Animals and Plants – Effective Market Analysis Tool
#Business Strategy #Market and Competitor Analysis #Diagram
-

User Experience Advantage Analysis Chart – Visualizing Competitive Edge
#Product/Service Introduction #Market and Competitor Analysis #Diagram
-

Fashion Design Comparative Donut Chart – Market Share Analysis
#Market and Competitor Analysis #Graph #Market Share
-

Money Donut Chart for Market Share Analysis – Emphasizing Competitive Advantage
#Market and Competitor Analysis #Diagram #Graph
