Market Share by Instrument Visualization – Donut Chart for Market Analysis
RJ0800041_20
- Last Update 08/29/2025
- File Size 7.6MB
- # of Slides 2
- File Format PPTX
- Slide Ratio 16:9
- Color
Keywords
About the Product
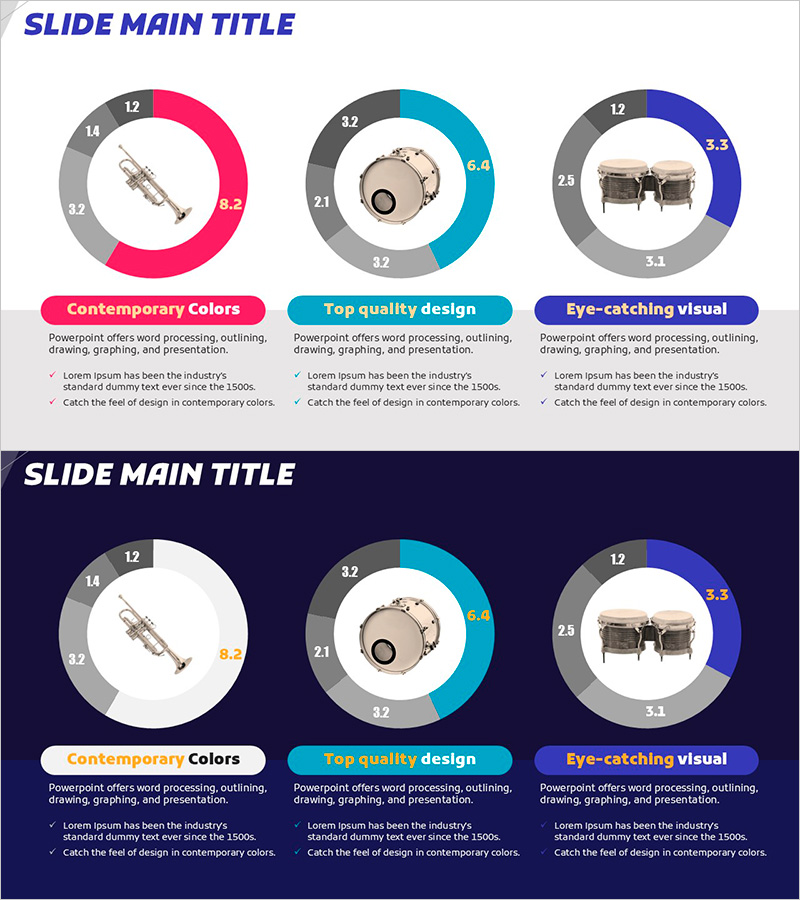
A PowerPoint slide featuring a three-color donut chart visualizing instrument market share with a central product image. This design effectively communicates competitive analysis, category-based market share, and sales composition through intuitive data representation. The contrasting color palette—magenta, cyan, and navy—clearly distinguishes each data segment, while numeric labels on the outer ring provide precise values. Ideal for market analysis presentations, investor pitches, and business reports, this 2-slide set is ready for immediate use in professional settings.
Usage Points
-
Main Usage
Visualize market analysis, competitive positioning, sales composition, and category-based market share using a donut chart format. The central product image clarifies the presentation topic, while numeric labels ensure accurate data communication to your audience.
-
How to Use
Apply this template in marketing plans, business reports, investor presentations, and market analysis decks. Replace the central image to adapt the slide for various industries—music retail, audio equipment, instrument manufacturing, or related sectors. Customize data values and labels to match your specific market research.
-
Recommended For
Marketing managers, business strategists, sales directors, financial analysts, and management consultants preparing market analysis, competitive strategy, and investor presentations. Particularly suited for music, instrument, and audio equipment industry professionals.
-
Slide Structure
Two-slide set, each featuring a three-segment donut chart (magenta, cyan, navy) with a central instrument image. Numeric labels (8.2, 6.4, 3.3, etc.) appear on the outer ring to indicate segment percentages. Bottom section includes legend and descriptive text area for additional context.
Related Products
-

Donut Chart Slide for Market Share Status – Asset Management Development
#Product/Service Introduction #Market and Competitor Analysis #Diagram
-

Mobile App Market Share Analysis Graph
#Product/Service Introduction #Market and Competitor Analysis #Diagram
-

Baby Products Business Market Share – Visualized with Trendy Design
#Product/Service Introduction #Market and Competitor Analysis #Diagram
-

Market Share Analysis with Donut Diagram – Easy Data Visualization
#Market and Competitor Analysis #Diagram #Graph
