Animals Nature Donut Chart Infographics – Market Share Analysis
RJ0600074_8
- Last Update 07/10/2025
- File Size 3MB
- # of Slides 2
- File Format PPTX
- Slide Ratio 16:9
- Color
Keywords
- #Content-Based Slides
- #Design-Based Slides
- #Market and Competitor Analysis
- #Graph
- #Market Share
- #Competitive Advantage
- #Circles
- #Doughnut Chart
- #16:9
- #donut chart PowerPoint
- #donut chart slide template
- #pie chart infographic
- #ratio comparison slide
- #market share chart
- #competitive analysis PowerPoint
About the Product
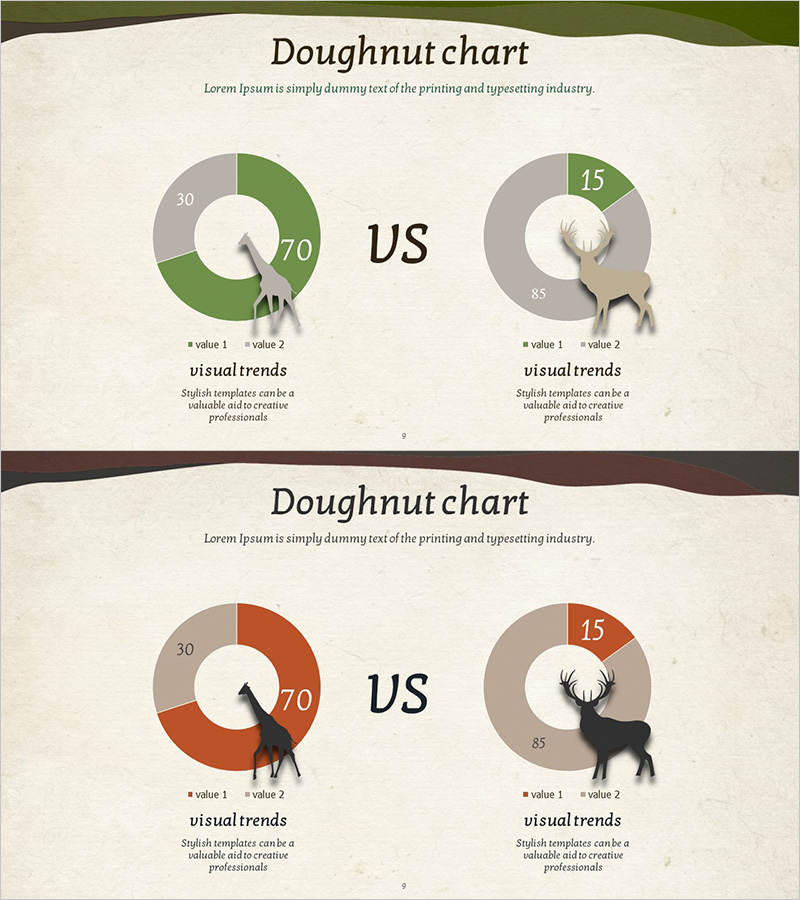
A donut chart PowerPoint slide template designed for visualizing market share, competitive analysis, sales distribution, and proportion comparisons. Two color variations are included: green-gray and orange-gray combinations. Each slide features a two-series donut chart on the left side with numerical data (70:30 ratio example) and an animal silhouette illustration on the right for visual comparison. The 16:9 widescreen format includes 2 fully editable slides where you can easily modify data values, percentages, and legend labels. The nature-themed animal motif adds visual interest and approachability to your presentation.
Usage Points
-
Main Usage
Clearly visualize two-item numerical comparisons such as market share, competitor benchmarking, sales distribution, and customer composition ratios. The animal silhouette placed in the donut center enhances visual impact while maintaining data clarity.
-
How to Use
Use in business presentations, marketing strategy meetings, financial reports, and business analysis documents to represent proportion data. Simply edit the numerical values, percentages, and colors to match your specific data for immediate use.
-
Recommended For
Marketing managers, sales directors, financial analysts, business strategists, and consultants who need data-driven presentations. Particularly effective for competitive analysis, market research reports, and sales performance reviews.
-
Slide Structure
2-slide set with identical layout structure. Each slide displays a two-series donut chart on the left (70:30 ratio example) with animal silhouette on the right. First slide uses green-gray palette; second uses orange-gray palette for flexible presentation contexts.
Related Products
-

Fashion Design Comparative Donut Chart – Market Share Analysis
#Market and Competitor Analysis #Graph #Market Share
-

Green Red Donut Chart – Market Share Analysis
#Market and Competitor Analysis #Graph #Market Share
-

Running Silhouette Donut Chart
#Market and Competitor Analysis #Graph #Market Share
-

Korean Traditional Culture Share Chart – Highlighting Cultural Excellence
#Operational Plan #Market and Competitor Analysis #Graph
