Dental Caries Treatment Analysis Donut Circle Graph – A Clear Competitive Edge
RJ0400034_12
- Last Update 05/26/2025
- File Size 2.5MB
- # of Slides 2
- File Format PPTX
- Slide Ratio 16:9
- Color
Keywords
- #Content-Based Slides
- #Design-Based Slides
- #Market and Competitor Analysis
- #Diagram
- #Graph
- #Competitor Analysis
- #Competitive Advantage
- #Cluster
- #Circles
- #Closed Cluster Diagram
- #Doughnut Chart
- #16:9
- #donut chart PowerPoint
- #pie chart slide template
- #3-segment ratio graph
- #market analysis chart
- #dental care analysis PPT
- #circular graph PowerPoint slide
About the Product
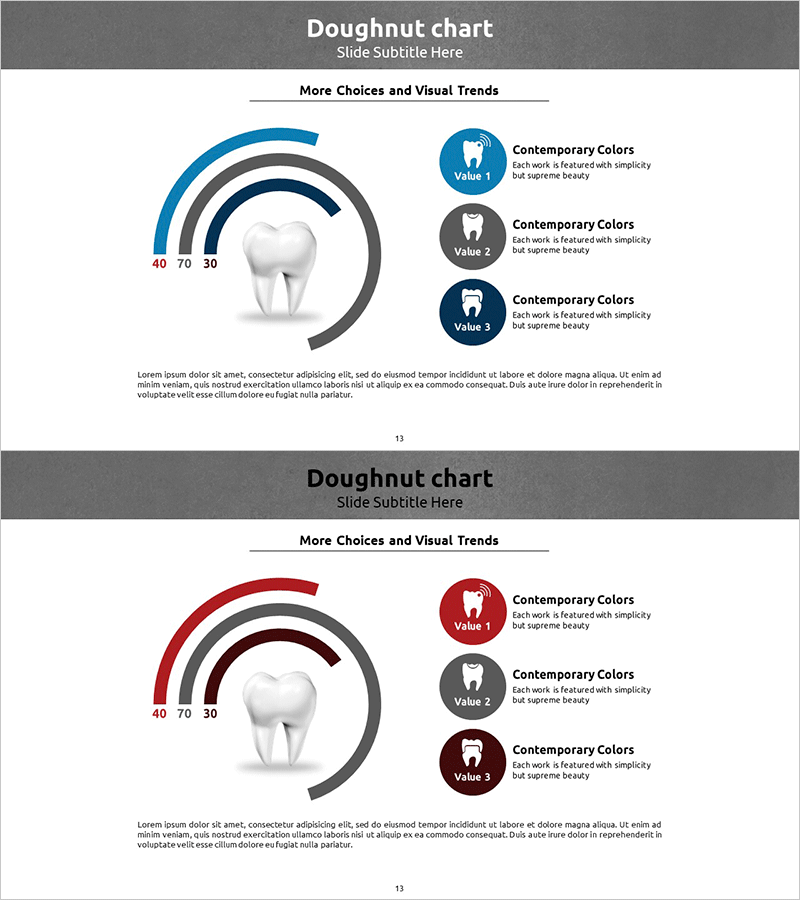
A donut chart PowerPoint slide optimized for dental care market analysis and competitive positioning. The design features a 3D tooth illustration at the center surrounded by three concentric donut rings representing data segments. Three color schemes—blue, gray, and navy—distinguish each data series, with numerical labels (40, 70, 30) positioned on the left for clear readability. The layout combines visual hierarchy with data clarity, making it ideal for presentations, reports, and marketing strategy documents requiring ratio comparison and market share visualization. Two slide variations are provided: a blue version for professional credibility and a wine-red version for premium positioning.
Usage Points
-
Main Usage
Visualizes dental market analysis, competitive comparison, and market share distribution. The concentric donut structure layers multiple data series hierarchically, while the central illustration reinforces the presentation topic. Ideal for ratio-based data visualization in business presentations.
-
How to Use
Insert into the market analysis or competitive positioning section of your presentation. Edit numerical values to reflect actual data, and adjust colors and labels as needed. Use the blue version for trust-focused presentations and the wine-red version for premium brand positioning.
-
Recommended For
Dental clinics and healthcare institutions presenting management reports, medical marketing professionals conducting market analysis, healthcare consulting firms preparing proposals, and dental franchise expansion presentations. Applicable to any industry requiring ratio comparison and market positioning analysis.
-
Slide Structure
Two-slide set. Each slide features a 3D tooth illustration centered with three concentric donut rings. Numerical labels (40, 70, 30) appear on the left side. Three legend items with circular icons and descriptive text are positioned on the right. A text area at the bottom accommodates additional information or explanatory notes.
Related Products
-

Business Competitive Advantage Analysis Graph – Differentiation in the Market
#Market and Competitor Analysis #Diagram #Graph
-

Competitive Comparison Silhouette Diagram – A Strategic Analysis Tool
#Market and Competitor Analysis #Diagram #Competitor Analysis
-

Core Transport Competitiveness Analysis – Intuitive Visualization with Graphs
#Market and Competitor Analysis #Graph #Competitor Analysis
-

Mobile Service Technology Analysis Graph – Market and Competitor Analysis
#Market and Competitor Analysis #Diagram #Graph
