Market Trends Analysis Chart – Effective for Market and Marketing Strategy
RJ0800011_22
- Last Update 08/02/2025
- File Size 0.3MB
- # of Slides 2
- File Format PPTX
- Slide Ratio 16:9
- Color
Keywords
- #Content-Based Slides
- #Design-Based Slides
- #Market and Competitor Analysis
- #Marketing Plan and Strategy
- #Diagram
- #Graph
- #Industry Trends
- #Marketing Strategy
- #Cluster
- #Horizontal Bar
- #Column
- #Closed Cluster Diagram
- #Segmented Column
- #16:9
- #stacked bar chart PowerPoint
- #vertical bar graph template
- #market trend analysis slide
- #4-year comparison chart
- #marketing data visualization PowerPoint
About the Product
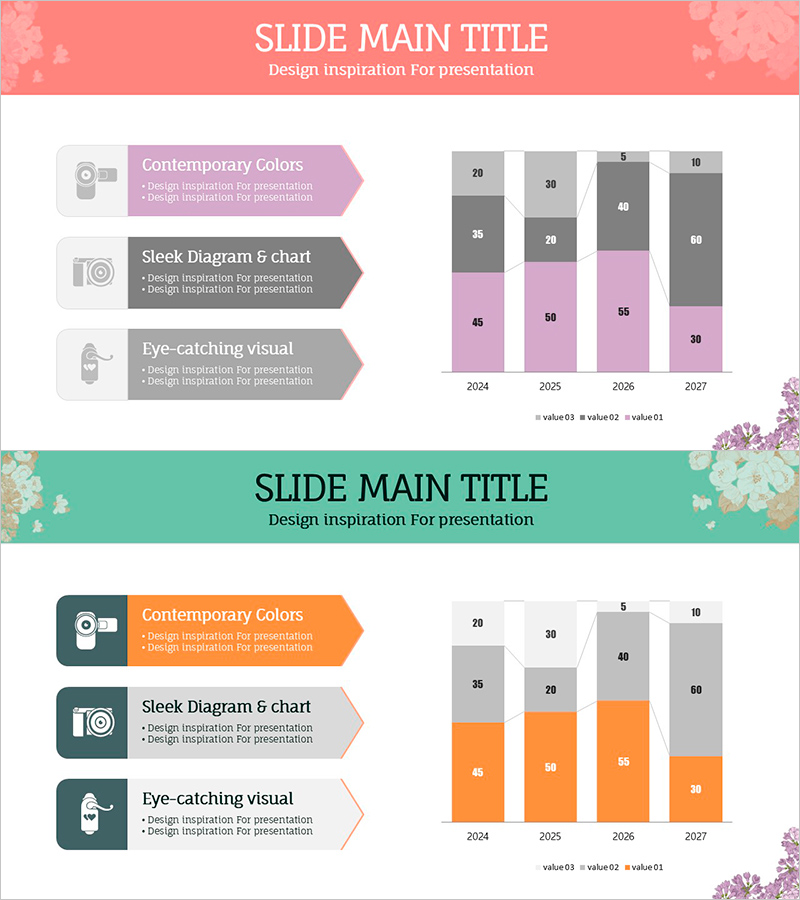
A stacked vertical bar chart PowerPoint slide designed for market trend analysis and marketing strategy presentations. This slide visualizes four years of data (2024–2027) across three data series, enabling simultaneous representation of market size changes and compositional ratios. The color palette combines pink, gray, and white tones that harmonize with presentation backgrounds, while clear numerical labels on each bar segment enhance audience comprehension during live presentations. Provided in fully editable PPTX format, allowing quick data updates while preserving the chart structure. Ideal for quarterly reports, annual business planning, and investor presentations requiring data-driven insights.
Usage Points
-
Main Usage
Effectively communicates market size evolution and component contribution over a four-year period during market analysis and strategic planning phases. The stacked structure allows simultaneous viewing of total growth trajectory and individual series performance, making it ideal for executive briefings, investor presentations, and competitive analysis reports.
-
How to Use
Select from two included slide layouts. The standard layout positions three descriptive text items with icons on the left side and the stacked bar chart on the right, creating natural alignment between speaker narration and visual content. Use PowerPoint's native chart editing tools to update numerical values; the graph automatically recalculates and refreshes.
-
Recommended For
Marketing managers, business planning teams, sales executives, management consultants, and investor relations specialists presenting market analysis findings. Suitable for quarterly performance reviews, annual strategic planning presentations, new business proposals, and any data-driven decision-making scenario requiring clear trend visualization.
-
Slide Structure
Two slide layouts with consistent design. Each layout features three icon-labeled text items (Contemporary Colors, Sleek Diagram & chart, Eye-catching visual) on the left side and a stacked vertical bar chart on the right displaying four years (2024–2027) across three data series (value03, value02, value01). Pink, gray, and white color differentiation creates clear visual hierarchy and data series distinction.
Related Products
-

Split Bar Graph and Pill Shape Diagram – Highlighting Marketing Strategy
#Market and Competitor Analysis #Marketing Plan and Strategy #Diagram
-

Housing Construction Business Trend Graph – Market Analysis Opportunities
#Market and Competitor Analysis #Graph #Industry Trends
-

Sales Trends Over the Past Four Years - Graph for Market Analysis and Achievements
#Business Strategy #Market and Competitor Analysis #Graph
-

Analysis of Changes in Transportation Vehicles Using Horizontal Bar Chart
#Market and Competitor Analysis #Graph #Industry Trends
