Split Bar Graph and Pill Shape Diagram – Highlighting Marketing Strategy
RJ0700014_29
- Last Update 07/25/2025
- File Size 0.4MB
- # of Slides 2
- File Format PPTX
- Slide Ratio 16:9
- Color
Keywords
- #Content-Based Slides
- #Design-Based Slides
- #Market and Competitor Analysis
- #Marketing Plan and Strategy
- #Diagram
- #Graph
- #Market Analysis
- #Marketing Strategy
- #Cluster
- #Horizontal Bar
- #Closed Cluster Diagram
- #Segmented Horizontal Bar
- #16:9
- #split bar graph PowerPoint
- #capsule diagram slide template
- #marketing strategy presentation
- #4-item comparison chart
- #data visualization slides
- #PowerPoint graph template
About the Product
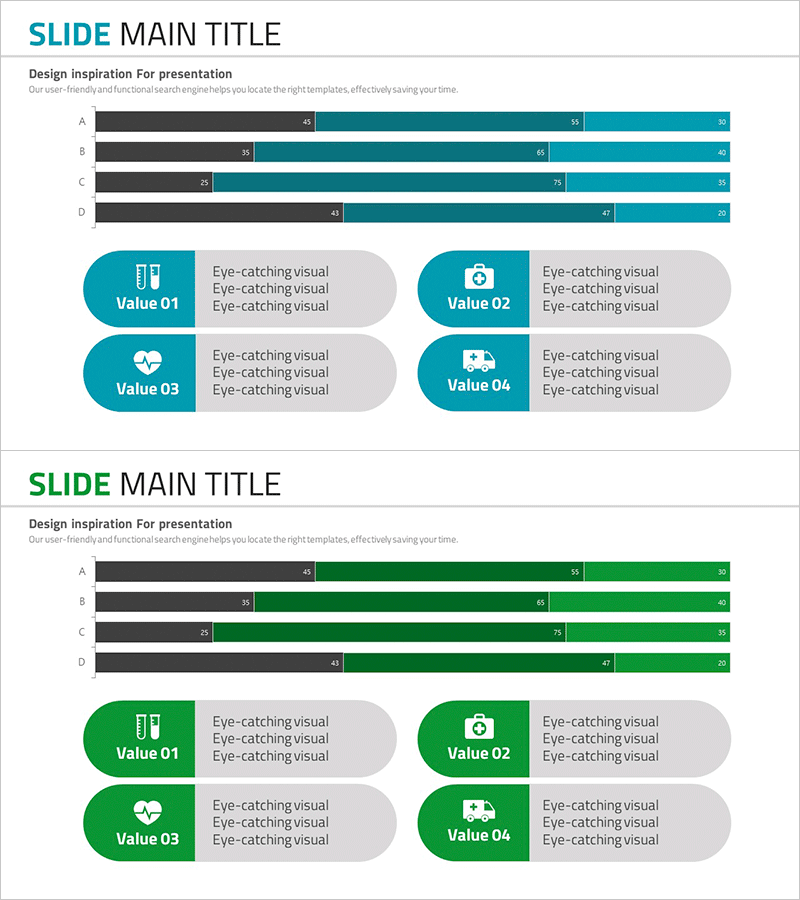
A 2-slide PowerPoint presentation template optimized for marketing strategy planning and market analysis presentations. The first slide features a split bar graph comparing four items (A, B, C, D) with black baseline bars and teal data bars, enabling clear numerical comparison and trend visualization. The second slide combines four capsule-shaped diagrams with icons to emphasize core values (Value 01–04), ready for immediate use in pitch decks and strategic documents. Delivered in 16:9 widescreen PPTX format, fully compatible with all modern presentation software.
Usage Points
-
Main Usage
Ideal for marketing strategy presentations, market analysis reports, competitive benchmarking, and KPI visualization. The split bar graph clearly compares multiple metrics across categories, while capsule diagrams highlight strategic pillars and core initiatives in a visually distinct format.
-
How to Use
Replace sample data in the first slide's bar graph with actual figures representing marketing channel performance, quarterly revenue, customer segment metrics, or competitive analysis. Update the second slide's capsule boxes with strategic priorities such as brand enhancement, customer acquisition, revenue growth, or market expansion.
-
Recommended For
Marketing managers, business strategists, C-suite executives, consulting firms, advertising agencies, and product teams preparing strategy presentations. Particularly effective when simultaneous multi-metric comparison and key message emphasis are required.
-
Slide Structure
Slide 1: 4-item split bar graph with black baseline bars, teal data bars, and numeric labels for A, B, C, D categories. Slide 2: Four capsule-shaped containers with icons and text areas for Value 01–04. Unified teal and gray color scheme maintains visual hierarchy across both slides.
Related Products
-

Business Solutions Analysis Graph – The Optimal Tool for Market Analysis
#Business Introduction #Market and Competitor Analysis #Diagram
-

Space Industry Segmentation Bar Graph – Essential for Market Analysis
#Market and Competitor Analysis #Diagram #Graph
-

Performance Analysis Breakdown Bar Graph – Market and Competitor Analysis
#Company Introduction #Market and Competitor Analysis #Diagram
-

Market Analysis Graph Ahead of the Future – Innovative Business Insights
#Market and Competitor Analysis #Diagram #Graph
