Four-Year Industrial Market Trends – Market Analysis and Decisions
RJ0900017_20
- Last Update 08/20/2025
- File Size 0.3MB
- # of Slides 2
- File Format PPTX
- Slide Ratio 16:9
- Color
Keywords
- #Content-Based Slides
- #Design-Based Slides
- #Market and Competitor Analysis
- #Financial Plans and Performance
- #Graph
- #Industry Trends
- #Capital Requirements
- #Column
- #Segmented Column
- #16:9
- #horizontal bar chart PowerPoint
- #market analysis slide template
- #data visualization chart
- #stacked bar graph template
- #time-series data PowerPoint slide
About the Product
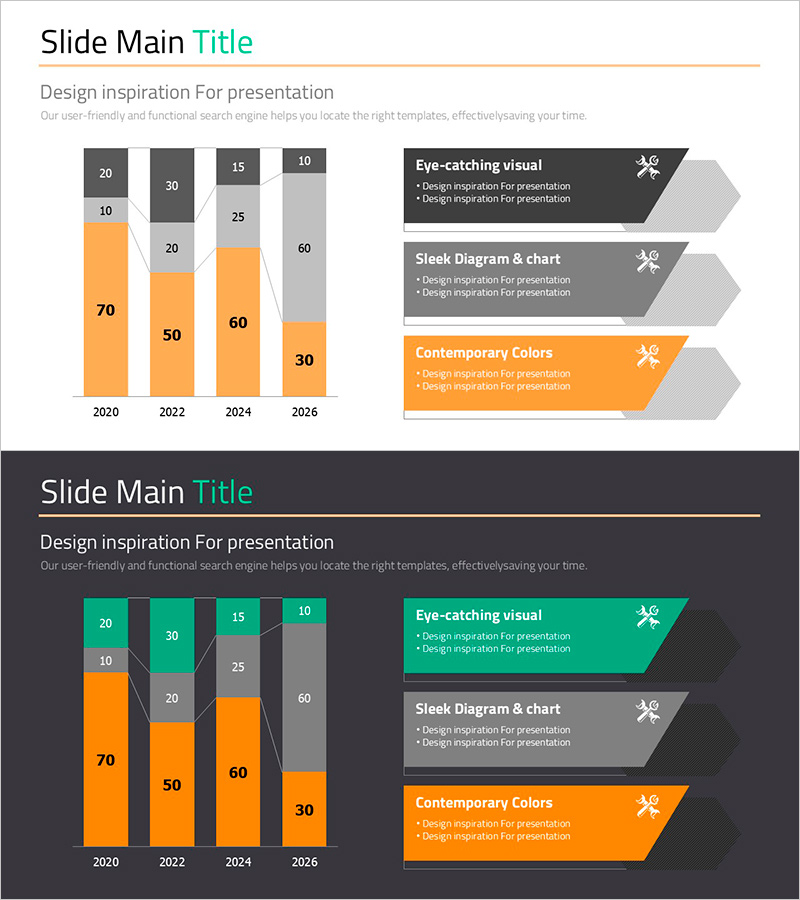
A PowerPoint slide featuring a horizontal bar chart displaying four-year industrial market trends from 2020 to 2026. The design uses orange and gray color contrast to clearly distinguish data categories, making year-over-year market changes immediately visible. Each year is represented as a stacked horizontal bar showing both total market size and component composition ratios. The slide effectively communicates complex market data through intuitive visual hierarchy, making it ideal for executive presentations, market analysis reports, and strategic decision-making materials. Fully editable and ready for immediate use in business presentations.
Usage Points
-
Main Usage
Visualize four-year industrial market trends using stacked horizontal bars to simultaneously display total market size and component breakdown. Designed for executive reports, investor presentations, and strategic planning meetings where clear data communication drives decision-making and stakeholder confidence.
-
How to Use
Slide 1 presents the main four-year horizontal bar chart with four data categories per year. Slide 2 includes the same chart plus three right-aligned text boxes (arrow-shaped callouts) for key insights and analysis points. Simply replace the sample data with your actual figures and customize the text boxes with your findings. Color scheme and layout are fully editable in PowerPoint.
-
Recommended For
C-suite executives and board members reviewing quarterly/annual performance reports, marketing teams presenting market analysis and competitive benchmarking, investor relations professionals preparing pitch decks, business development teams creating proposal documents, management consultants delivering industry analysis reports, and manufacturing or distribution companies presenting market positioning strategies.
-
Slide Structure
Slide 1: Horizontal stacked bar chart with 4 years (2020, 2022, 2024, 2026) × 4 data categories (gray and orange segments) with numerical labels. Slide 2: Identical chart + 3 right-side arrow-shaped text boxes (gray, orange, white backgrounds). 16:9 widescreen format, fully editable PPTX.
Related Products
-

Market Analysis with Horizontal and Vertical Bar Charts – Recent Trends Review
#Market and Competitor Analysis #Financial Plans and Performance #Diagram
-

Technology Status Analysis Graph – Presenting Market Trends
#Market and Competitor Analysis #Financial Plans and Performance #Graph
-

Natural Vertical Bar Segment Chart – A Key Tool for Market Analysis
#Business Strategy #Market and Competitor Analysis #Graph
-

Sophisticated Vertical Bar Chart – Market Trend Analysis
#Market and Competitor Analysis #Graph #Industry Trends
