Performance Analysis Pie Chart – Market Share Visualization
RM0400010_7
- Last Update 02/17/2025
- File Size 0.7MB
- # of Slides 2
- File Format PPTX
- Slide Ratio 16:9
- Color
Keywords
About the Product
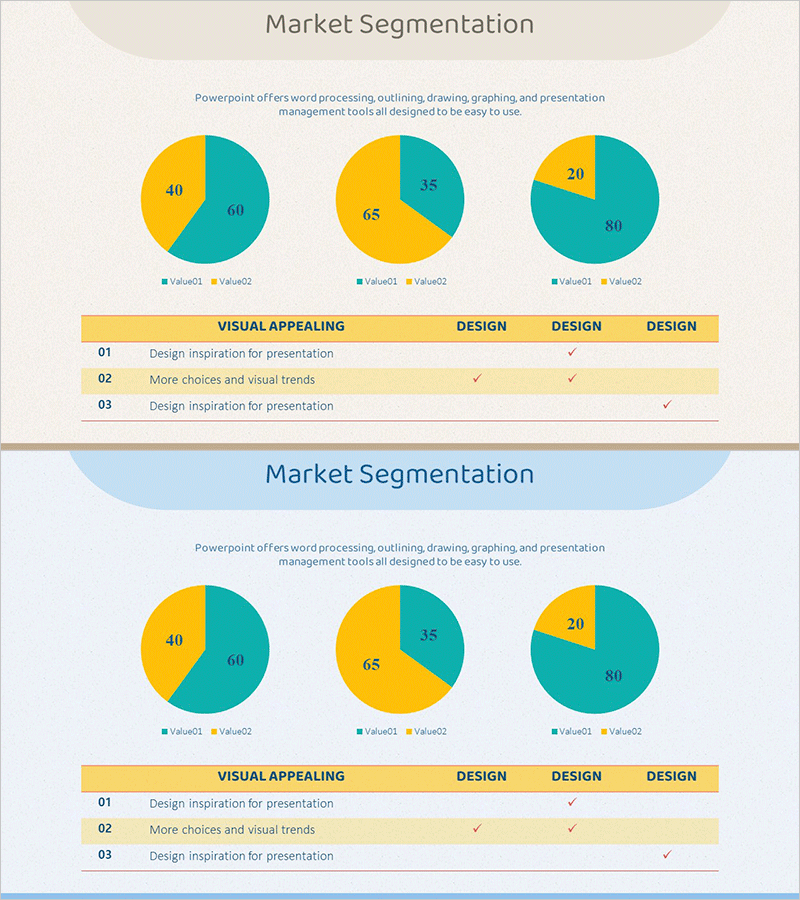
A professional pie chart slide designed for market analysis and performance evaluation presentations. Three pie charts are arranged horizontally, each divided into two segments using teal and gold color schemes. Each chart displays data values and legends for immediate use in your PowerPoint presentation. The slide is formatted in 16:9 widescreen and compatible with business reports, marketing proposals, quarterly performance reviews, and investor presentations. All chart elements are fully editable to accommodate your specific data.
Usage Points
-
Main Usage
Visualize proportional relationships such as market share, sales distribution, customer composition, and budget allocation using pie charts. Three side-by-side charts enable simultaneous comparison of data across different time periods, departments, or product categories.
-
How to Use
Replace the default values and labels with your own data to create a customized presentation. Insert the slide into market analysis sections, performance report pages, marketing proposal customer segments, or any presentation requiring ratio visualization to enhance audience comprehension.
-
Recommended For
Marketing managers, sales directors, financial analysts, business executives, management consultants, and educators who need to present data-driven insights. Ideal for quarterly performance presentations, investor pitch decks, client proposals, and strategic business reviews.
-
Slide Structure
Two-slide template. First slide features a beige background with three horizontally arranged pie charts, each divided into two segments (Value01 and Value02) with legends and numerical labels. Second slide repeats the same structure with a light blue background, providing two distinct design options for presentation variety.
Related Products
-

Modern Blue Pie Chart Template – Market Share Analysis
#Market and Competitor Analysis #Diagram #Graph
-

Market Analysis Report Visualized with Pie Chart
#Market and Competitor Analysis #Diagram #Graph
-

Target Market Share Analysis – Visualizing Market Analysis with Pie Chart
#Market and Competitor Analysis #Graph #Other
-

Red-Blue Stereoscopic Pie Charts – Performance Visualization
#Company Introduction #Market and Competitor Analysis #Diagram
