Market Share and Analysis Graph – Blue, Orange, Green
RJ0400017_19
- Last Update 05/21/2025
- File Size 0.2MB
- # of Slides 2
- File Format PPTX
- Slide Ratio 16:9
- Color
Keywords
About the Product
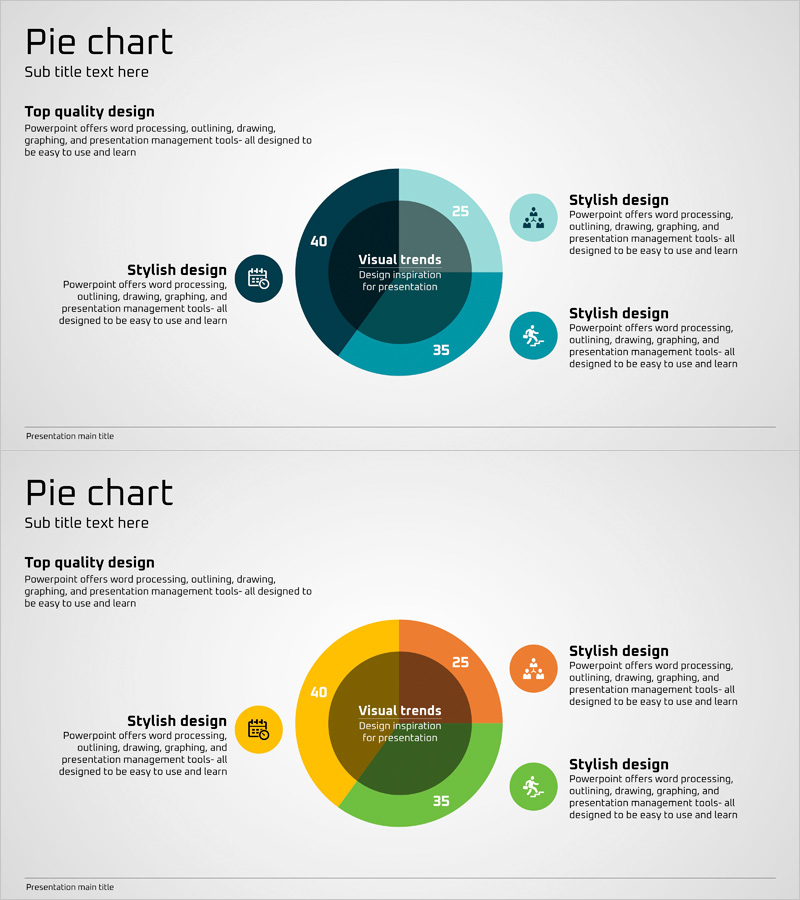
A professional pie chart PowerPoint slide that visualizes market share and data proportions with three distinct segments in dark blue (40%), orange (35%), and green (25%). Each section displays clear numerical values and labels for immediate comprehension. The left side features icons paired with detailed descriptive text, enhancing information delivery and audience engagement. This presentation template is optimized for market analysis, sales performance reporting, customer composition breakdown, and other ratio-based data visualization needs. Fully editable PPTX format allows quick customization for your specific data.
Usage Points
-
Main Usage
Clearly visualizes market share, sales ratios, customer composition, and budget allocation by showing each category's proportion relative to the whole. The three-segment design enables instant comparison of relative sizes, making it ideal for executive reports, marketing analysis presentations, and financial performance briefings.
-
How to Use
Replace the pie segment percentages and labels with your actual data values. Edit the left-side icons and descriptive text to match your content. Colors can be easily modified to match your brand guidelines. Additional text boxes can be inserted if more explanation is needed. The slide is optimized for 16:9 widescreen display.
-
Recommended For
Executives, marketing managers, financial analysts, sales directors, and consultants who need to present data-driven insights. Ideal for quarterly performance reports, market research presentations, investment proposals, business plans, and strategic planning documents.
-
Slide Structure
The template includes 2 slides, each featuring a centered 3-segment pie chart. The left side displays 3 icons with corresponding descriptive text blocks, while the right side provides additional space for supplementary information, allowing flexible content expansion and customization.
Related Products
-

Detailed Analysis Pie Chart – Market Share and Promising Competitors
#Market and Competitor Analysis #Graph #Market Share
-

Analysis by Pie Chart Item – Visualizing Market Share
#Market and Competitor Analysis #Graph #Market Share
-

Performance Analysis Pie Chart – Market Share Visualization
#Market and Competitor Analysis #Diagram #Graph
-

Market Share Visualization of Three Countries – Effective Data Analysis
#Market and Competitor Analysis #Graph #Other
